In this article, I show how you can move Citrix policies configured in Studio, to Group Policy.
Whilst I am not recommending this is what you do, typically it is advised to manage policies from one location or the other. The scenario I am targeting is when a Citrix administrator inherits a Citrix site, and they prefer not to manage policies via Studio. In this case, the administrator will migrate the policies away from Studio and across to Group Policy.
The below Citrix Policy is up for migration. It has a mixture of user and computer settings.
On your Delivery Controller, launch PowerShell and run the following commands:
Note: The value CTX – Global Policy is the name of the Group Policy Object that you are using to transfer the policy settings to.
Run command cd CitrixPolicies:\User
You can run command dir | selectName to get a list of the Studio policies that have user settings in them.
Run command copy “Global Policy” GroupPolicies:\User
Note: Value Global Policy is the name of the Studio policy that you are migrating user settings from.
Navigate to the Group Policy Management Console and confirm the migrated user policy settings appear as expected.
Return back to the Delivery Controller and run the following commands:
cd Computer
copy “Global Policy” GroupPolicies:\Computer
Note: Value Group Policy is the name of the Studio policy that you are migrating user settings from.
Navigate to the Group Policy Management Console and confirm the migrated computer policy settings appear as expected.
You can optionally delete the migrated policy from Studio by running command Remove-Item “Computer\Global Policy”,”User\Global Policy” -Recurse after changing directory to the root of the CitrixPolicies PowerShell drive.
Citrix Virtual Apps and Desktops deployments are performance sensitive. There are many components both datacentre-side and client-side which must be optimally performing together to deliver a consistent and performing virtualised apps and desktops solution.
With many different components in play, it can often be a challenging task for a Citrix administrator to determine the impact or cause of a Citrix related problem.
Stats from the 2018 Citrix Migration Survey
From the 2018 Migration Survey conducted by eG Innovations, some interesting statistics surfaced:
59% of 795 Citrix professionals voted that slow logons were the number one problem for them.
44% voted that frozen sessions were a problem.
33% voted that slow application launches were almost as common as any other fault.
Recently, I joined forces with eG Innovations to deliver a webinar on the topic “Citrix Troubleshooting 101”. The webinar had a great turnout with over 1450 people registering for it, and over 650 joining on the day. The webinar was hugely popular simply because as mentioned, Citrix administrators want to be able to quickly and more efficiently diagnose issues within the environment.
As highlighted in the webinar, Citrix issues result ultimately in lost productivity and company revenue. The severity of lost productivity and revenue is mainly determined by the time it takes to resolve an issue. For an administrator to be successful in Citrix troubleshooting, process of elimination is key. Process of elimination can be applied to three particular troubleshooting tactics that were highlighted in the webinar. Following these tactics will help you to become more efficient at diagnosing Citrix problems:
Determine the scope of the problem – Does the user face an issue with a task they are trying to complete, or all tasks?
Determine the magnitude of the problem – How many users are impacted?
Determine the source of the problem – Does the issue reside client-side or within the corporate infrastructure?
During the webinar around 40 questions were asked by the audience. Given that we had no time to answer them all live, I wanted to take this opportunity to answer them here. The questions are grouped into three categories for ease of readability: Citrix Troubleshooting, Citrix Optimisation and Citrix Monitoring.
Questions and Answers for Citrix Troubleshooting 101
Citrix Troubleshooting
1.
Are there any tips to improve remote access performance?
1. Firstly, on Citrix ADC (formerly NetScaler), bind the TCP profile “nstcp_default_XA_XD_profile” to your Gateway virtual server. 2. Secondly, edit profile “nstcp_default_XA_XD_profile” on ADC and uncheck “Use Nagle’s algorithm”. 3. Take a look at the “Optimized for WAN” Citrix policy template within Citrix Studio, which will give pointers to configuring policy settings that can help improve performance over WAN. 4. Consider preparing your ADC Gateway virtual servers and end-user devices to support Adaptive Transport. You can read more here: https://www.jgspiers.com/hdx-enlightened-data-transport/
2.
Can you configure Citrix Director’s application probing for published desktops?
No, currently, Citrix Director’s application probing only supports published applications. You may want to consider logon simulators and full session simulators available in the market. See the following links: https://www.jgspiers.com/app-probing-vs-logon-simulation/
Regarding brokering times with different versions, have you seen significant difference between 7.15 to 7.18?
I haven’t personally seen any significant differences nor have I come across any Citrix publication regarding this.
5.
Our user logon times are about 30 seconds, with Internet Explorer initialization taking most time. What would you advise to help us make logons faster?
To improve logon times on Citrix Virtual Apps and Desktops, you can use several optimisation scripts for Windows server and desktop operating systems which I have created, See https://www.jgspiers.com/category/scripts/
Besides this, other common practices for reducing logon times include Group Policy housekeeping, profile management best practice configuration, Write Cache best practice configuration, auto-logon and so on.
How do you quantify slow logon. Is a 30-second logon considered slow?
30 seconds and below is what I like to achieve in all my deployments. I can accept 40 seconds or less, but 30 seconds downwards is the real goal.
7.
We are using Citrix Workspace Environment Management (WEM) in our infrastructure. Are there any disadvantages of using WEM over CPM? Also, is WEM available for on-premises XenDesktop?
WEM and CPM are different products and they both have different uses. It can actually be beneficial to run both, as they work together well. Citrix WEM applies printers, mapped drives, registry settings and other actions to a user’s desktop session. Profile Management captures and roams the user profile between desktop or virtual application sessions.
WEM is available with XenDesktop Enterprise (now Virtual Apps & Desktops Advanced) and above subscriptions.
8.
We have XenApp 6.5/XenApp 7.6, and we have published the same apps on Windows 2008 and Windows 2016 respectively. But performance is slow on XenApp 7.13/Windows 2016. Why do you think this would be?
One of the reasons for this could be that you have not optimised the Windows Server 2016 image? Default settings in the operating system are not the best. Please refer to my optimisation script: https://www.jgspiers.com/windows-server-2016-optimisation-script/
Also keep in mind that out of the box Windows Server 2016 will require more resource than Windows Server 2008. So, you should assign an extra 1-2GB RAM and another 1-2vCPU and see if there is much difference in performance between the two environments.
9.
Often our users get the “session interrupted” notification on the corner of their session. Would this be network related? Or is it an issue in the client side?
“Session interrupted” notifications generally occur when there is a network issue between the Virtual Apps server or desktop and the client terminal. I would run through a process of elimination to see if the issue only happens at a specific user location, with specific endpoint clients, with specific Receiver versions and so on.
You could also monitor the VDAs and check to see if there are TCP connection drops being reported. Have your network team run tests on the networking devices that are client-side to see if there is any packet loss.
10.
Do you have any thoughts on what’s the main cause of PVS target retries and how to troubleshoot them effectively?
This can be caused by network blips such as spikes in latency/packet loss. A slow performing/saturated storage array where the Target Device is stored or the PVS vDisks are stored can also be the cause of retries.
11.
How often do you recommend we reboot XenServer hypervisors?
I only recommend rebooting XenServer hypervisors either during disaster recovery testing phases, or when applying hotfixes to XenServer.
12.
How often should VDA’s be rebooted?
I typically like to reboot my virtual apps workers at least every 1-3 days, however it again depends on how often the VDAs are used and how much resource is assigned to them.
13.
Is there any tool that can identify slow printing in a Citrix session?
Third-party products can monitor print servers, VDAs, and the network to inform you if there are problems. Often slow printing can be the result of bad printer routing e.g. a printer and print server with a lot of latency between them or too many hops in the communication path. For this, take a look at the Citrix policy setting “Direct connections to print servers” which is explained in detail here: https://www.jgspiers.com/citrix-universal-printing/ Other reasons for slow printing can be due to outdated/problematic print drivers in use, or lack of bandwidth/prioritisation of the printing virtual channel (ICA).
14.
What UDP port is needed for EDT?
UDP ports 1494 and 2598 are required. If you are providing EDT access via Citrix Gateway, then only UDP 2598 is required to be open from the Internet to Gateway.
15.
Is there any way of easily finding bandwidth issues with NetScaler? We have a VPX 200 and are wondering whether it is a bottleneck for external users.
The “Packet CPU Usage” counter on the Dashboard of Citrix ADC will show you if the ADC device is reaching it’s bandwidth limit or not. You can run reports from the Reporting tab. A built-in report named “CPU vs. Memory Usage and HTTP Requests Rate” can help.
Likely the Citrix Gateway is not the bottleneck though. If you are connecting in from a high-speed, broadband link and you still see latency, which would be cause for concern and potentially point towards it being a Gateway or DMZ issue.
Citrix ADM (Application Delivery Management – formerly known as NetScaler Management and Analytics System/MAS) can help help track HDX Insight data and get reports on WAN latency, ICA RTT, datacentre latency and so on. See https://www.jgspiers.com/citrix-netscaler-management-analytics-system/
16.
Is it possible to enable Receiver logging on a thin client, i.e. HP thin client or Dell thin client?
There are procedures set out by Citrix on how to enable logging for Windows and Linux etc. Workspace app (Receiver) editions. You should consult with your thin client vendor on how these procedures can be carried out on the thin client.
17.
Error 1102: The Citrix Broker Service failed to broker a connection for user ‘Domain.com\user’ to resource ‘Desktop1234’. The virtual machines ‘WIN10-091.domain.com’ rejected the request to prepare itself for a connection. This problem usually indicates that the virtual machine is engaged in an activity such as restarting, entering a suspended state, or processing a recent disconnection or logoff. Do you have any guidance to troubleshoot this?
Determine if this issue only happens to particular VDAs, particular VDA versions etc.
Also check how many users are currently connected and if you have enough VDAs/resource to handle more users.
If this issue is only experienced during logon storms such as in the morning, then there might be a lack of VDAs to handle the concurrent logon rate (which can be adjusted via policy).
18.
I would really like to know if Citrix offers a documented protocol for troubleshooting the software stack. Something starting with what baselines to get when things are working and what corrective actions to take when a given part of the stack is not meeting those baselines at the time people are complaining.
You can capture baselines yourself at the beginning of a deployment which helps when comparing the same once users have been loaded on to the environment. However, you really need third-party monitoring solutions that can alert you when parts of the infrastructure are under stress or down. You can configure alerts when metrics breach defined thresholds for example logon times. Citrix Director has some of this capability, but the capability is dictated by the license you own and is limited more to monitoring Citrix VDAs and sessions, and not so much the supporting infrastructure.
19.
We have seen many issues with respect to degraded performance and session disconnected issues. We are supporting multiple versions of XenApp & XenDesktop both on-premises and in the cloud. Performance degrades both in published application and VDI. We have not seen any network issues. Users can’t launch the session if the session is in a disconnected state (not all times). I have seen this issue often in cloud. Do you have any tips to investigate and address this?
It is a problem that could be caused by many things. I would try to eliminate possibilities of it being the image, high CPU/RAM consumption on VDAs, Workspace app version, client used, network location used, VDA version used and so on. If it happens in cloud, I assume you have VDAs in Azure or AWS. The degraded performance and disconnects typically relate to network issues but it could be the VDA itself hanging. You will have to start troubleshooting from a high level and work your way down as you rule factors out one by one.
20.
How to troubleshoot TDIca.sys BSOD? This is on a Windows Server 2008 R2 image and our current version of Citrix is 7.15.3000. We have them hosted on VMware 5.5 using MCS. When I first created the Site, all was working fine without any issues. I didn’t even have to do a weekly reboot, but now this seems to happen on a weekly basis. Any tips to triage this issue?
I would look at what has changed in the environment. Sometimes it is quicker to build a fresh new image considering the problems you face and the time it may take to troubleshoot them.
21.
Recently we upgraded XenApp 7.6 to 7.15 CU3 after which some features inside the published apps are not functioning when users launch URLs from 7.6 dedicated Windows 7 VDI. When they launch the same URLs outside of a VDI desktop (local computer), RDP, vSphere, all app features are opening as expected. Only VDI users are getting this problem. What could be the issue?
You have a XenDesktop 7.6 VDI site running Windows 7 VDAs, and those guys launch published apps from a XenApp 7.15 CU3 site. Now some of the features inside the published apps no longer work, whereas they used to work when running XenApp 7.6. Has anything else changed on the Windows 7 image such as an upgrade of Receiver for Windows?
22.
When I’m undocking the laptop from the disk (wired) and continuing to work under wireless LAN for 1 hour in the conference room, and after returning to the desk and docking the laptop back on the base-station (wired), the Citrix virtualized application session that previously ran then fails to respond. What is the likely cause, how to troubleshoot it? Is there any tool available to detect or even auto-fix the issue?
Have you tried updating to the latest Workspace app, or tried the same scenario using a newer VDA version? If that does not work I would suggest you contact Citrix support.
23.
Launching a virtual application takes forever – crawling slowly that the response was like progressing in each of the launching stages for 5 minutes or more. Though no apparent network bottleneck was suspected when transmitted across the network outside Citrix. On another occasion, the same application just launches within 1-2 minutes. What do you think would be causing the delay?
Monitoring tools such as eG Innovations can give detailed insight in to the Citrix logon process and what is causing the various steps to take so long.
You should put one of the affected VDAs into an isolated Active Directory Organizational Unit with no Group Policies applying.
Other things to try are testing the logon time through a console session rather than ICA, disabling profile management (if in use) and so on.
Process of elimination will help find the root cause quicker.
24.
Is any script available to auto-delete user profiles from a profile server which will help admins from manually doing it?
Profile Management can auto-delete profiles from a VDA using policy setting “Delete locally cached profiles on logoff”. When it comes to deleting profiles from a profile server automatically, there isn’t any script out there to do that. The script wouldn’t know which profile to delete and when.
25.
Does Citrix Cloud make troubleshooting any easier?
The answer is both yes and no! You have less to troubleshoot because management of the control plane (Delivery Controllers, SQL servers, etc.) is done by Citrix. This said:
– You are still responsible for monitoring and managing the virtual apps servers and virtual desktops; – And you still have ownership of the overall service performance. When there is slowness, you will still need to understand how to pinpoint where an issue lies. If the issue is with Citrix Cloud, then you must depend on Citrix to fix it.
I’m optimizing a Windows 10 image using App Layering but unsure which layer I should remove UWP applications from?
You should remove these applications from the OS Layer.
27.
What about antivirus solutions, do you recommend installing antivirus on the main image? Or do you recommend deploying antivirus on Delivery Group desktops?
Antivirus agents should be installed on the gold image, and all other infrastructure components such as your Delivery Controllers and StoreFront servers.
Hypervisor introspection is a technology that allows for lightweight agents or no agents at all to be placed on the VDA to reduce footprint. This technology can help with scalability.
28.
What is the ideal spec for VDA?
There is no ideal specification as it depends on the workloads of your users. Typical “Task Worker”, “Knowledge Worker”, and “Power User” Windows 10 workloads may be able to use “2vCPU/2GB RAM”, “2vCPU/4GB RAM”, and “4vCPU/8GB RAM” configurations respectively, but you need to test these numbers in your own environment.
29.
For best performance, you recommended, ‘Have enough DDCs to handle requests.’ What numbers would you recommend?
A Delivery Controller can support up to 5000 VDAs. If you have 10,000 VDAs for example, deploy 3 DDCs minimum. You should always follow the N+1 model. This allows you to endure a Delivery Controller failure without impact.
30.
I have seen dramatic differences in the use of Write Cache space if a machine vDisk is ‘optimized’ after imaging or updating a master VM. Can you explain why this is so?
An optimised image is leaner, so there is less going on. That is the reality. As a result, the Write Cache should not be used as much as a bulky image with everything turned on would use it. I suggest regularly performing a disk defragmentation on your vDisks as that also drives down Write Cache usage.
31.
Will session pre-launch utilize system resources even if the user has not launched the application?
Yes. Some processes on the VDA will be running, ultimately consuming resource. However, the resource utilisation should be low given the session will be idle.
Citrix Monitoring
32.
For monitoring AppFlow, you mentioned a Premium ADC license is required. Does an Advanced ADC license not give AppFlow monitoring? Is there any other option there to monitor AppFlow?
For HDX Insight, a Premium license offers historical capturing of this data. An Advanced license only provides 1 hour, so basically real-time capturing. Web Insight is different, and does not have a licensing requirement.
eG Innovations and other Citrix Ready monitoring partners offer AppFlow monitoring capabilities that will work if you have an advanced ADC license.
33.
I have some users who report that their session was slow outside of general business hours and Citrix Director doesn’t show if anything was wrong at that time. What tools can I use to capture historic statistics about each virtual desktop?
Citrix ADM (Application Delivery Management) is useful if the affected users are remote workers and your bottleneck is in the network.
Citrix Director provides visibility into specific parts of the infrastructure. To get complete end-to-end visibility into the Citrix tiers (StoreFront, Virtual app servers, license servers, Delivery Controllers, ADCs, PVS, WEM, etc.) and the supporting infrastructure, you can look at eG Innovations and other third-party monitoring solution bendors.
34.
Can eG Enterprise detect issues with NetScaler? What is there are session drops? Can you monitor NetScaler devices and flows?
Yes, eG Enterprise monitors Citrix ADC/NetScaler in-depth. See https://www.eginnovations.com/solutions/citrix-netscaler All the key metrics of NetScaler can be monitored agentless. AppFlow data from NetScalers can be exported to eG Enterprise and analyses as well.
35.
From a security standpoint, I don’t want to send monitoring data outside my datacenter. Is that possible with eG Enterprise?
Yes, eG Enterprise offers an on-premises solution. The management server, reporting engine and agents can all be deployed on-premise and no data is sent to the cloud.
36.
Can Smart Tools only be used if you have an active Citrix Cloud platform?
Which tool(s) can provide a logon breakdown? GPO, full breakdown of interactive session, etc.?
Citrix Director 7.18 can provide statistics for Profile Load, Brokering time, GPO Processing time and so on. A further enhancement was made to the product in 7.18 that breaks Interactive Session time down into three sub-sections.
Third-party monitoring tools such as eG Enterprise have been providing breakups of Citrix logon timeincluding details of interactive session time. This is useful for administrators to quickly determine which logons are slow because of profile loading and which GPOs are slowing down logons. See https://www.eginnovations.com/solutions/citrix-logon-monitoring
38.
Can eG Enterprise be used in conjunction with 3rd party profile management tools such as FSLogix or Liquidware?
eG Enterprise is compatible with all third-party Citrix profile management solutions.
39.
In the demo of eG Enterprise, you showed some use cases for detecting slow logon issues, virtualization issues, and non-corporate apps being the cause of resource depletion. What other Citrix problems can eG Enterprise help troubleshoot that Citrix Director cannot?
There are many ways in which eG Enterprise brings value to Citrix customers. These include: – Ability to monitor the user experience using synthetic monitoring (logon simulation and full session simulation) – More granular insights into why Citrix logons are slow. – Real-time monitoring of application launch times and proactive alerting through auto-baselining. – Unified visibility into all the Citrix tiers – StoreFront, WEM, PVS, ADC, License server, Delivery Controllers, Virtual App servers and Virtual Desktops – Integrated monitoring of all the supporting tiers including network, virtualization, cloud, storage, Active Directory and so on. – Embedded auto-correlation and root-cause diagnosis technology that helps easily determine if slowness is due to a Citrix problem or not. Refer to this blog post for a detailed comparison of Citrix Director and eG Enterprise: https://www.eginnovations.com/blog/citrix-director-end-to-end-citrix-workspace-monitoring/
40.
We end up chasing Citrix issues, only to find that it is a problem with a user’s network connection. Can eG Enterprise help us identify these types of problems?
Yes, eG Enterprise monitors ICA round trip time (ICA RTT) which is the latency that the user perceives. In addition, it can report the network latency between the user terminal and the server farm. By comparing these two values, administrators can easily identify if there is a network issue that is affecting Citrix performance. See this short video on how eG Enterprise makes Citrix troubleshooting simple.
41.
How can we monitor and identify what is causing long VDI logons. We are currently using VDI’s for about a year now, but since last year December something changed (we don’t know what) that our logon time has increased from about 45 seconds to 2 minutes or more. I know we can use Citrix Director, but I wanted to see if there is another tool that can show more details.
Third-party solutions such as eG Enterprise will provide you with more detail around the logon steps and what is causing them to take a long time. Whilst you say nothing has changed, it would be worth reviewing if any Group Policy settings have been added, or what Windows updates have been installed since December. Other things to investigate is drive maps and printer mapping via Group Policy. Are the printers/drive map locations still available? Does Event Viewer on the VDAs give any hints?
42.
I have no data being written to the monitoring database, so I see no data in Director. This is after migrating the database from the local SQL Express database to SQL Server 2016 on another server. What should I check to troubleshoot this?
If you have any further questions on the topic of Citrix troubleshooting, or even if you want to let me know how some of the tips shared in this webinar had a positive effect on your ability to troubleshoot, please leave a comment in the comments section below.
You can watch the recording of the Citrix Troubleshooting 101 webinar at your convenience: Citrix Troubleshooting 101
Citrix Studio integrates with App-V in either Single Admin or Dual Admin mode. The benefits of Single Admin mode is that essentially no App-V Management or Steaming servers are required. This is achievable because Citrix Virtual Apps and Desktops can directly hook into the SMB network share where App-V packages are stored.
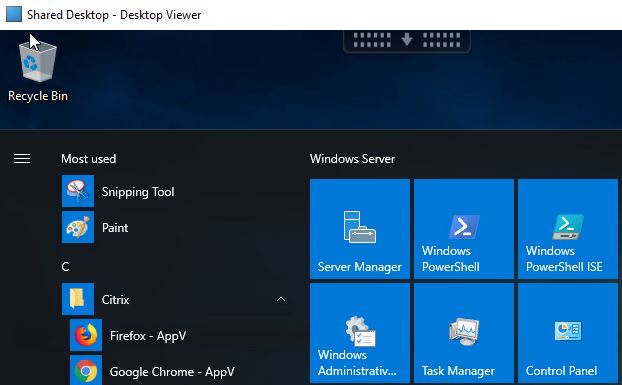
One of the limitations I have recently encountered some customers facing is how App-V packages are launched when published from Studio and accessed via shared desktops.
Take the following scenario: You have a Virtual Apps deployment and most of your users access a hosted shared desktop, which runs on Windows Server 2016 OS. App-V is also used in the environment, so you have added App-V packages to Studio using Single Admin mode and published them to the same Delivery Group that delivers your hosted shared desktop.
Workspace app is installed on the shared desktop VDA and places the App-V application shortcuts in the user’s Start Menu.
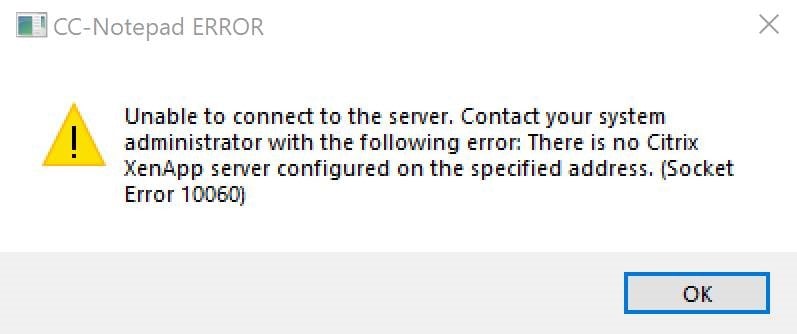
When a user goes to launch an App-V application, the behaviour is not what you might expect. Instead of the App-V application launching locally, it instead launches on a different VDA within the same Delivery Group.
This means that the entire logon process takes place again, and a new HDX session is established.
The end result is a new ICA connection and a longer application launch time.
With vPrefer/Prefer
Without vPrefer/Prefer
Application launch time
13 seconds
47 seconds
There are two ways to work around this current limitation. You can either use the vPrefer (newer) feature, or the older Prefer feature.
If you are using Virtual Apps and Desktops versions up to 7.16, you can only use the Prefer method. If you are using Virtual Apps and Desktops versions from 7.17 and above, you can use the vPrefer method.
vPrefer – Virtual Apps and Desktops 7.17+
Requirements (minimum):
StoreFront 3.14 (ships with 7.17 Virtual Apps and Desktops media)
Delivery Controller 7.17
Receiver for Windows 4.11
Configuration: On your Delivery Controller, launch PowerShell and run command asnp Citrix.* followed by Get-BrokerApplication. In this example, notice how the Firefox App-V application I have published from Studio has a property called CommandLineExecutable and a value of CtxAppVLauncher.exe.
To make vPrefer launch the App-V package locally, we need to reference the full path to CtxAppVLauncher.exe. To do so for all App-V applications published in Studio, run command:
Open Group Policy Management Console, create a new GPO which applies to your VDAs. The policy setting named vPrefer that you should enable is found under Computer Configuration -> Policies -> Administrative Templates -> Citrix Components -> Citrix Receiver -> SelfService
You have three options to choose from:
Allow all apps – All applications including Win32 apps such as Notepad and Calculator will launch instead of the equivalent published app.
Allow installed apps – Locally installed applications that are not Win32 apps will launch instead of the equivalent published app.
Allow network apps – Published apps will always launch.
Note: If the above policy is unconfigured, the default behaviour is Allow installed apps.
Select Allow all apps and click OK.
That is all that is required for vPrefer to launch App-V applications on the same VDA that a user is already receiving their published desktop from.
Prefer – Virtual Apps and Desktops below version 7.17 (including 7.15 LTSR)
Configuration:
Just like vPrefer, to make Prefer launch the App-V package locally, we need to reference the full path to CtxAppVLauncher.exe via PowerShell for each App-V application. To do so for all App-V applications published in Studio, run command:
On each Shared Desktop VDA, you need to create a folder with shortcuts to the applications you want Prefer to launch locally. On your Gold Image for example, create an AppShortcuts directory under C:\.
On each Shared Desktop VDA, you need to create a registry string that points to the directory you just created. On your Gold Image for example, create a PreferTemplateDirectory string with value C:\AppShortcuts under HKLM\SOFTWARE\WOW6432Node\Citrix\Dazzle.
Populate the AppShortcuts directory with shortcuts to your App-V applications. The shortcut must begin with the path to CtxAppVLauncher.exe, and end with the App-V application GUID. First, under Type the location of the item, enter “C:\Program Files\Citrix\Virtual Desktop Agent\CtxAppVLauncher.exe”.
To obtain the GUID of each App-V application you want to launch locally, open Citrix Studio and browse to the App-V application properties. Under the Location tab you will find the GUID. Copy it.
Paste the GUID value into the field as below. Click Next.
Specify a name for the shortcut that is different from the name published in Studio. If you don’t, Workspace app will not know what app to select. Click Finish.
Perform the same task for each of the App-V applications that you wish to launch locally.
Browse back to Studio and edit each App-V application. On the Identification tab and under the Description and keywords field, enter KEYWORDS:prefer=Firefox where Firefox equals the name of the shortcut you published to the AppShortcuts folder. Note that prefer is case sensitive. Click OK and repeat for each App-V application.
As a user logs on to their shared desktop, with Start Menu integration configured for Workspace app, the shortcuts from the AppShortcuts folder will be copied as below. When launched, App-V launches locally rather than a new HDX session establishing.
Note: Applications have to be in the Start Menu for the Prefer keyword to work. Disabling Self Service, disabling User Subscriptions (in StoreFront) or assigning the Mandatory keyword to App-V applications will force them to appear in the Start Menu.
In this article, we touch on what synthetic application availability testing is including reasons why you should consider using it in your Citrix environment. We then discuss two specific products that exist in the market to achieve synthetic availability testing against virtualised applications and desktops.
Synthetic availability testing is important, here’s why
Before I explain the importance of application availability testing, it is wise to cover in simple terms that synthetic availability testing is the process of automating real user actions and analysing the outcome. It has been referred to as logon simulation, though modern tools are more advanced, and is often accomplished by the use of logon simulator agents.
Say you have a Virtual Apps deployment that offers access to critical applications to users who may be anywhere in the world. With typical monitoring solutions, we can constantly check the health of our Citrix infrastructure and alert when parts of the infrastructure become unhealthy or starts to perform badly. Synthetic application availability testing takes a different approach and adds value to basic monitoring solutions.
With synthetic application availability testing, we are automating the same actions a user would take to launch their virtual applications and/or desktops. What this means is that typically a test will automate browsing to StoreFront, authenticating, clicking on an application or desktop, launching that application or desktop, and connecting to it via Workspace app and so on.
All these steps are recorded from a success/failure standpoint. Some availability testing products also record the time to complete each step, as a success does not necessarily mean that your users are getting the experience they expect. Ideally, test results are integrated with your monitoring solution dashboard, so you can view the results of each simulation in real-time, or potentially historically. Some products generate automatic alerts if a failure occurs in a step, or a step is taking too long to complete. This means customers are proactively alerted to issues in an environment before users are impacted.
Synthetic availability testing adds value to existing monitoring solutions by actually performing the same steps that a user takes to launch applications and/or desktops. This approach to monitoring gives further benefits to monitoring infrastructure components with probes and measurements. It also can free up the ICT teams who look after your Citrix environment. Typically, dedicated teams have a list of checks they need to perform in the morning or throughout the day, and many of those checks include launching applications and desktops. Now, synthetic availability testing can do that for you, which frees up a lot of staff time so that they can divert their efforts to other tasks. Even better, some synthetic solutions do this from your key user locations, testing the entire infrastructure along the way.
Which products provide availability testing?
We will concentrate on the following two products that offer synthetic availability testing today:
Application probing, a feature within Citrix Director 7.18 and above.
Goliath Application Availability Monitor (GAAM) from Goliath Technologies.
Application probing – a closer look
Application probing is a feature that shipped originally with Citrix Director 7.18. The configuration simply consists of one or multiple agents (also referred to as probe agents) that automate the launching of published applications. Results are then fed into Director.
The agent is installed on a Windows machine that must have Receiver for Windows 4.8 or newer, or Workspace app 1808 for Windows or newer installed. You configure the agent to connect to Director and configure probes directly from the Director console. The initial setup requires few actions and is easy to complete.
Given that there are many steps involved with launching an application, application probing analyses the below steps and reports on their failure or success:
StoreFront reachability
StoreFront authentication
Application enumeration
ICA file download
Application launch
The benefits of application probing is that it is effectively testing the majority of your Citrix infrastructure for you. For an application launch to be successful the Delivery Controllers, StoreFront servers, and the VDAs etc. all need to be working as expected.
Application probing in action
When you deploy a probe agent, and after configuring it to probe an application, the Director dashboard will display Application Analytics results over a period of 24 hours. The Applications page is basically a quick summary that you can check on to review probe results. It shows the number of probes that are configured within your Site, the application(s) being probed, probe results from the last 24 hours, and the number of application faults etc. as a result of failed probes.
Towards the bottom of the Application Analytics page appears the Summary of Application Probe Failures panel that lists out each component that application probing tests, and if there have been any failures with any of these components over the past 24 hours. As you can see from the below screenshot, 1 probe out of 2 failed at the StoreFront Reachability stage.
If you click on the StoreFront Reachability hyperlink, you can see a filtered results view, which in this case is showing the probe results that have failed at the StoreFront Reachability stage, over the last 24 hours. This is simply a filtered view under Trends -> Application Probe Results.
You can change the filter conditions to show all probe results over the past 7 days for example. Some probes in the below example failed at the StoreFront Reachability and Application Launch stages.
You also have the option of viewing results over 24 hours. If you want to view results for a specific application, simply type the application name in the Application field.
The different stages can also be used to filter the results.
If any probe fails at the Application Launch stage, failures are also recorded under Trends -> Application Failures. You can export this data to PDF, CSV or Excel format.
Goliath Application Availability Monitor (GAAM) – a closer look
Application Availability Monitor is a synthetic application availability testing tool from Goliath Technologies. You can deploy GAAM as a standalone product, or as a fully integrated part of the Goliath Performance Monitor solution, which is what I have done during my evaluation of the product. Results from simulations are fed into the Goliath Performance Monitor web console for additional troubleshooting.
GAAM can simulate the launch of either published applications or desktops across Virtual Apps and Desktops environments. This is done by using one or more Intelligent Agents, which are Windows machines (physical or virtual) that have the GAAM agent installed. These machines can be in your local datacentres, or even in AWS or Azure public cloud.
Simulations are performed at set times of the day of your choosing, and GAAM offers very flexible simulation schedules based on your requirements. For example, you may want to run simulations before your critical user base logs on for the day, or you may want to run simulations as frequent as every 30 minutes every day to support a 24/7 environment.
GAAM simulates logging on to StoreFront, or Citrix Gateway using the Internet Explorer 11 browser. Applications and/or desktops are launched via an HDX connection, and then the HDX session is logged off. The time taken to complete the various steps involved in the launch process is captured, as well as the success and failure of these steps. Uniquely, screenshots are also taken of each step to prove that the step either worked, or to show the failure point and any error that may have come with it. This is crucial to capture both elusive client-side errors, and document issues with other team members or outside vendors for faster resolution.
The benefits of Application Availability Monitor are that it is effectively testing the majority of your Citrix infrastructure for you. For an application launch to be successful the Delivery Controllers, StoreFront servers, and the VDAs etc. all need to be working as expected as well as the network connections at each location. GAAM ensures the entire delivery infrastructure is working in concert as intended.
Application Availability Monitor analyses the following steps and reports on their failure or success, and time to complete:
Access to StoreFront (via Internet Explorer).
Authentication to StoreFront.
Application/desktop enumeration.
Application/desktop launch.
Application Availability Monitor in action
To configure GAAM, you deploy one or more Intelligent Agents within your environment. The agents will typically be deployed in locations that match where your users are located. Once an agent is configured and ready to be used, you create flexible probe schedules for applications and/or desktops of your choice. Whilst agents may be distributed across many locations, GAAM’s centralised command and control makes scheduling and management easy. Goliath customers have reported running 15,000 tests per day with GAAM, which would otherwise be extremely difficult and time consuming to schedule or manage with Application probing.
As probes run per the schedule defined, the Application Availability tab of the Goliath Performance Monitor web console is where you can go to get a view of the results.
The main Dashboard view can be filtered based on date/time, allowing you not only to view current probe results, but historic ones as well. It shows the current availability of the resources you are probing. It also reports the number of simulations that have executed during that time period, and a bar chart displays depicting the application or desktop availability percentage, and the average launch time (in seconds).
Towards the bottom of the Dashboard sub-tab shows the average time to complete each simulated step in the logon process, and a chart for easy viewing of each step and where most of the load time is encountered.
The Analysis sub-tab shows results per simulation. Results can be filtered on date/time, including by the Intelligent Agent running the probe, and including by the application/desktop that is being probed. The same bar chart that can be found on the Dashboard sub-tab is also displayed here. It’s important to note that GAAM allows you to store this information for as long as you wish, allowing the same granular views to be seen going back weeks or even months for detailed analysis or troubleshooting.
Towards the bottom of the Analysis page is the results of each probe depending on the date/time filter you have applied. In the example below, we can see that the simulations are all appearing as healthy. The Access, Auth, Resources, Enumeration, and Launch steps have green ticks, and the launch time is recorded healthy. The end point running the simulation is recorded, as well as date/time and the application/desktop being probed. If you want to view more details about a specific test, simply click on the magnifying glass.
Once you click on the magnifying glass to open a specific result, a new window appears with in-depth information regarding the simulation. Each icon coloured in blue is clickable and represents each simulated step. A log of the actions taken to complete each step appears on the left, and a screenshot for proof is displayed on the right. Clicking on the screenshot will enlarge it to full-screen. In this example simulation, the Details section reports that Internet Explorer was launched, StoreFront was navigated to and the login page was detected. At this stage the step was marked as complete and a screenshot was captured by and stored on the Intelligent Agent machine.
Clicking on the resources step icon reports information related to that step, and a screenshot to show that the step was successful. In this case, the resources page was detected.
If you have any simulations that have encountered a failure, they will also display under the Analysis page. The web page makes it easy to spot failures by using red colour coding against the step that failed. In this example, you can see that one of my simulations has failed at the Resources step.
Clicking on the magnifying glass and then on the Resources icon shows numerous Waiting messages, but straight away we can simply glance at the screenshot captured by GAAM and discover the Cannot complete your request error message. In this example, some services were in a stopped state on the StoreFront server.
Scrolling to the bottom of the details pane shows error message FAILURE – SF RESOURCES PAGE NOT FOUND.
Another failure example shows an error at the Enumeration step. The Details pane shows error FAILURE – RESOURCE ‘Shared Desktop’ NOT FOUND, but the screenshot is more interesting: There are no apps or desktops available to you at this time. In this example, Delivery Controllers could not be contacted for resource enumeration.
On the Schedule sub-tab of Application Availability, here you can create and manage all of your probes.
For each probe, you can launch one or multiple applications and/or desktops. Alerts can also be configured during the creation of a probe under the Alert Settings tab. Currently Email, SNMP, and Syslog are available alerting options.
Reporting on the results of one or more simulations is also possible by clicking on the Report tab within the console. You can schedule a report from under the Schedule sub-tab to run at selected time periods, and have each generated report emailed to you or exported as a PDF, CSV or HTML file. Alternatively, you can report on-demand from the View sub-tab by clicking on the Alert Analysis report name and clicking Analyze.
Once an on-demand report is ready for viewing, the Results sub-tab will become clickable and allow you to view the full report. Each simulation is shown based on the time period you selected, and a history of the log/details data is available. On-demand reports can also be printed, emailed, or exported.
The pros and cons of each product
Citrix Application probing
Pros:
Probe results are shown direct from the Director web console, which eliminates the need for a separate console.
Citrix Gateway is supported with the 7 1811 release of Director.
Citrix Cloud/Workspace is supported.
Cons:
A small, lightweight agent needs to be placed on a dedicated machine from which probes will run from.
The time it takes to complete each stage of the probe is not captured. For example, application enumeration time to complete is not calculated.
Requires a Premium (formerly Platinum) Virtual Apps or Virtual Apps & Desktops license.
Reporting capabilities are scarce.
You cannot probe desktops, only published applications.
There is no current ability to schedule probe repeats. You need to create a new probe to select different probe execution times. For example, if you want to set up a simulation to test every one hour through the day, you have to configure 24 probes separately.
Goliath Application Availability Monitor
Pros:
The Intelligent Agent can bypass disclaimers set on your VDAs.
Both simulations via StoreFront and Gateway is supported.
Reporting capabilities are available for one or multiple simulations, and reports can be run on demand or via a schedule. Additional reports can be created with 3rd party tools like Microsoft Power BI or Tableau.
Success, failures and also the time taken to complete each step in the simulation is captured.
Screenshots are captured for each simulated step. This acts as visual proof where a step has succeeded or failed, captures any on-screen error messages, and can provide objective documentation of issues for working with team members or vendors.
SSO and MFA are both supported.
Results are integrated into Goliath Performance Monitor for further troubleshooting. For example, slow synthetic application launch times can be reviewed from Goliath’s logon duration details.
Citrix Virtual Apps and Desktops are supported along with VMware Horizon and Microsoft RDS.
A single agent can easily manage tests of multiple applications, desktops, or user credentials – all managed and scheduled centrally.
Cons:
A small, lightweight agent needs placed on a dedicated machine.
The machine that runs simulations must always be logged on as a local administrator account. Goliath Technologies do however provide an AutoLogon tool.
Conclusions
To wrap up the article, I’ve left some thoughts about where I think each product fits into an environment, based on the customers’ requirements:
Citrix Application probing
Application probing from Citrix is an easy to deploy, and relatively easy to configure product. When I say easy, you could easily configure it in under 30 minutes and have probes running against your most critical applications.
If you already have Premium (formerly Platinum) licensing for your Citrix Virtual Apps or Citrix Virtual Apps and Desktops deployment, then application probing comes as a nice value add at no extra cost.
The environments I see application probing fitting into today would be:
Organisations that:
are small in size and that do not deploy too many applications.
have simple probe scheduling needs, and do not need to probe desktops.
are only interested in probing their most crucial applications.
can live without any advanced reporting.
want to keep the number of consoles at a minimum, providing Application probing provides benefits to them.
are only interested in success and failures of the simulated steps, rather than the time to complete such steps.
When it comes to large enterprise environments that have many different applications, with users connecting in from different parts of the world, Application probing may not tick all the boxes. Some organisations require advanced reporting functionality, and the need to probe published desktops. Organisations also may simply not have Platinum licensing or the ability to procure such licensing.
Goliath Application Availability Monitor
Like Application probing, the Application Availability Monitor product is also easy to deploy, configure, maintain, and manage going forward. GAAM also offers an array of advanced capabilities for your testing needs.
If you already use Goliath Performance Monitor in your environment, or you need more detailed monitoring and troubleshooting of your Citrix environment, using both GPM and GAAM together is an obvious solution to those who need a proactive early warning system of issues in their environment.
The environments I see Application Availability Monitor fitting into today would be:
Organisations that:
are large in size and have a requirement to run simulations against many different applications.
have a requirement to run simulations against published desktops, or against multiple VDI platforms.
need advanced reporting and alerting capabilities for their simulations.
require the added value of screenshots of each simulated step and the time taken to complete each step.
use SSO or MFA.
use disclaimers and need to bypass them during simulations.
need more flexible scheduling capabilities and can make use of the advanced features that GAAM offers.
For customers who want synthetic application availability testing within their environment, they should evaluate not just the cost of Application probing or 3rd-party products such as Application Availability Monitor, but also the capabilities of each product to discover which one ticks most of the boxes.
Organizations looking to proactively solve end user experience issues in their environment should look no further than GAAM, the early warning system from Goliath Technologies. In terms of depth of information provided for each simulation, and the array of advanced capabilities that are on offer. The advantages of the product surpass having to manage an extra monitoring system outside of Director.
A list containing the majority of Citrix related Windows Server 2019 support articles collated to make this page a one stop place for you to search for and find information regarding any issues you have with the product and its related dependencies.
The page is updated daily with new support articles and information. Articles will change from time and if information here is outdated or incorrect please let me know using the comments. Links may also expire or change so if you find broken links, please again let me know. For each issue, known product versions affected are recorded however that does not mean product versions that aren’t listed are not affected.
There is a search box that you can use if looking for a specific fault. For example if you have an error code or error message, use that to perform a search. You can also use your browsers search feature which will perform a search against the whole page based on the words you enter.
Windows Server 2019:
wdt_ID
Brief Description of Issue
Brief Description of Fix
Applicable Product Versions Affected (if known)
Link to supplemental Support Article(s)
1
Virtual IP does not appear to work. When running command "ipconfig" you are returned with only one IP address even though two sessions are running on the server. The same configuration on Server 2016 works.
Local Tech Echo has been reintroduced by Citrix in FMA editions starting Virtual Apps 7 1811. If you have a Virtual Apps deployment that provides basic but critical data entry type business applications to staff from long distances over lossy, congested, and/or latent networks; Local Text Echo (LTE) can help.
Local Text Echo was previously named SpeedScreen Latency Reduction (SLR) in older versions of XenApp that used the IMA architecture. Some customers had a dependency on this feature which caused hesitation with migrations to 7.x, and as such, Citrix have brought it back.
The use case of Local Text Echo is quite simple: to help provide users with a near local experience when using Windows text input fields or basic HTML applications. Think web forms provided by Internet Explorer, Windows shell, Notepad type apps.
The feature achieves this by being visually manipulative. As you type text into a qualifying virtual app, that text is processed immediately on the local client whilst processed on the virtual app server in the background. This gives an end-user the perception that there is no latency or lag, even though there may be 400+ms latency.
Citrix have recently released different features through Virtual Apps and Desktops such as Adaptive Display v2, Adaptive Transport, and Adaptive Throughput. Each feature aims to provide a better user experience, reduce bandwidth usage, and offer superior performance over latent connections.
LTE is another feature that can help in situations where you provide virtual data-entry type applications to locations in the world that may not have the best network connections. Think high latency, low bandwidth connections. Many different business challenges are solved with the technologies Citrix have released.
Support with LTE is limited to basic text fields (notepad.exe) and standard web forms (iexplore.exe). There is no support for modern office applications.
To configure LTE, you firstly must be running Virtual Apps 1811 or higher. Client machines that connect in to these virtual apps must run Workspace app 1811 for Windows or higher.
The configuration of LTE can be completed in three steps:
Set ZLKeyboardMode=1 within default.ica on StoreFront.
Create two DWORDs within the registry of the connecting client machine.
Run ss3admin64.exe from the gold image which hosts the virtual application, and specify the application executable that LTE will be used on.
1. Configure StoreFront
Browse to C:\inetpub\wwwroot\Citrix\Citrix\App_Data\ where Citrix is the name of your store. Edit default.ica.
Under the [Application] section, specify one of the following values:
ZLKeyboardMode = 0 – LTE is off, regardless of what is configured on the Virtual Apps server.
ZLKeyboardMode = 1 – LTE is on, regardless of the latency thresholds set on the Virtual Apps server.
ZLKeyboardMode = 2 – LTE is set to auto, and will turn on/off based on the latency thresholds set on the Virtual Apps server.
2. Configure endpoint client that runs Workspace app
Open RegEdit.exe and browse to HKLM\SOFTWARE\WOW6432Node\Citrix\ICA Client\Engine\Configuration\Advanced\Modules. Create a key named GfxRender and then create the below DWORDs:
UseDirect3D with a value of 0x0.
PresentDevice with a value of 0x0.
3. Configure virtual app servers
On your gold image, the ss3admin64 tool is used to configure LTE. Browse to C:\Program Files (x86)\Citrix\System32\ and launch it.
Right-click the server entity listed under Configured application list and click Add New Application.
Click Next.
Click Browse to select an application.
Browse to a supported application such as Notepad. Click Open.
Click Next.
Check Enable local text echo for this application and click Next.
Select Apply settings to all installations of the selected application. Click Next.
Click Finish.
The application will now display under the Configured application list. If you right-click on it, you have the option of configuring more properties.
On the Application Properties tab, you can choose to disable LTE, configure a limit type, or force LTE to treat all input fields in this application in native mode.
The two limit type options are:
Display text in place – This is the default option.
Display text in a floating bubble – As you type into the application, text appears immediately in a bubble that sits above the application. Eventually, that same text displays within the application itself once processed server-side.
On the Input Field Configuration tab, you can configure LTE for certain input fields that are typically found in applications or basic HTML pages.
Besides application properties, you can also configure server properties by right-clicking on the listed server and selecting Server Properties.
Here you can enable LTE for all applications, enable mouse click feedback, and configure your latency thresholds which forces LTE on/off if LTE is configured in AUTO as per the StoreFront store/default.ica configuration.
Whilst Citrix Synergy 2019 was in full-flow in Atlanta, GA, Goliath Technologies were also keeping busy with the 11.7.8 release of Goliath Performance Monitor, which adds several features that were in demand by many customers.
I’ve had the chance to review this latest release, and wanted to touch on some of the features that are new to version 11.7.8, as well as cover ground on some of the features and capabilities already existing in the product today.
When an IT administrator receives alerts or calls from users reporting that their session is slow, their logon times are slow, or they cannot complete a specific workflow, often these calls are challenging to resolve because there are many components and factors at play that could be contributing to the issue.
Goliath Performance Monitor makes such reported faults easier to resolve by presenting to the administrator essentially the components of a Citrix environment and related infrastructure that are healthy, versus those that are under stress or in a failed state. The administrator can know when issues arise in an environment before users are impacted either by the various dashboards made available by GPM, or via proactive alerts via email or common ticketing systems.
With the information provided by GPM, take for example a logon duration report, the wealth of information is powerful to an administrator, but may require additional documentation to one who is not familiar with troubleshooting at such a detailed level. Since Goliath Performance Monitor captures over 33 stages of the logon process, there will be times when one or two metrics report back with high times, and the administrator may not exactly know how best to interpret what is being called out, or how best to troubleshoot the issue.
The new Troubleshooting Workflows are designed to help administrators with all levels of troubleshooting experience use the data Goliath Performance Monitor is collecting and presenting, to their advantage. You will be able to step through common troubleshooting issues backed up by real world use cases, and how to combat them effectively. This means IT professionals will be more effective and faster when it comes to resolving end user experience issues.
Network Operations Center (NOC) View
The Goliath Topology View shows you a high level view of your Citrix infrastructure, also known as the NOC view, with colour coding that represents the health of each component. This allows a Citrix administrator to very easily identify if a component is not operating as it should. You do not need to manually build out the dashboard. The system is intelligent enough to automatically map out all of your Citrix infrastructure components such as Delivery Controllers, Delivery Groups, and Machine Catalogs, and create physical and logical connections with other components in the environment.
This view is now enhanced by customised performance dashboards which provide a more detailed view of key metrics to support the overall health shown by the Topology View.
Those dashboard could be multiple datacentres, Citrix sites, or the different layers that GPM reports on. Dashboards auto-refresh at intervals configured by you, which is an existing capability of the product. With 11.7.8 these dashboards auto-refresh and auto-cycle, so you can now have multiple dashboards configured and displayed at defined intervals. With the NOC view, auto-refresh and auto-cycle functions, you can display powerful, flexible dashboards to mounted monitors or splash screens in your operations rooms or service desk centres.
Electronic Health Record Specific Modules
Goliath Performance Monitor 11.7.8 delivers unique, purpose-built modules for major EHR applications such as Epic, Cerner and MEDITECH to monitor and troubleshoot those mission critical systems. These modules, customer experience, and EHR vendor relationships establish Goliath Technologies as the Health IT Standard for monitoring and troubleshooting.
If you work in healthcare IT, you will know that a failure or simple performance degradation of an EHR system could have massive impact on patient care. Whilst we focus on our Citrix environment, it is equally as critical to monitor and troubleshoot the applications too, and the backend components that make them tick. With that in mind, you will want to support your EHR environment with products that go beyond simply UP and DOWN monitoring.
Features such as the Early Warning System from Goliath accesses these mission critical applications just like a real user would, and reports back details on logon times including screenshots if any errors exist in the logon and launch process. Resource load for virtual machines and the Citrix delivery infrastructure is constantly monitored, ICA latency is captured and so on. The information you need to ensure successful uptime and delivery of critical EHR applications on Citrix is taken care of with Goliath, and when things begin to go wrong, you can be proactive in troubleshooting before end-users are impacted.
Given that systems such as Epic are often accessible via Citrix Virtual Apps deployments, Goliath Performance Monitor can be the single platform for customers to monitor both their Citrix and EHR environments.
Intelligence and Automation
The intelligence and automation built into the product allows an organisation to prevent end user experience issues by focusing on the logon initiation process, logon process, and in-session performance. These are the three most common causes of a call to the helpdesk.
With over 250 key failure points being monitored out of the box, you don’t need to be a VDI expert to configure Goliath Performance Monitor, as it self-configures for you, which allows you to get to troubleshooting the environment quicker. The product also discovers and maps out your Citrix infrastructure to a Topology View, and has the ability to auto-deploy agents out to your virtual machines.
If specific faults, events or conditions are triggered in your environment, Goliath can automatically take care of the situation by restarting services, rebooting servers, or even running PowerShell scripts without the need for human intervention. This dramatically increases the time for resolution, and reduces the chances of an issue impacting end-users, as the issues are resolved right away as soon as they are initially detected. Both the Citrix workers and related infrastructure benefits from automated remediation actions. Some examples of automated remediation actions include:
Clearing print queues.
Ending disconnected user sessions.
Rebooting infrastructure servers, or services.
Rebooting VDAs, or services.
Terminating application processes.
As IT teams are always struggling to do more with less, it’s easy to see how these capabilities handle the monitoring and alerting tasks and speed troubleshooting and resolution – freeing team members to focus on other critical projects.
Advanced Reporting Capabilities
With every Citrix or End User Computing deployment, the user experience plays a large part in the success of the deployment. A lack of reporting capabilities prevents trends or larger issues from being discovered over time as a deployment matures, or as changes are made to the environment. It also prevents you from providing management with reports that would help justify the need for hardware upgrades, software upgrades, or new technology purchases. It also prevents you from sharing the success of a deployment or future upgrade with the business.
More than 66 reports exist out-of-the-box in Goliath Performance Monitor, allowing you to produce all sorts of thinkable reports from Citrix session activity, Virtual Apps ICA latency, user logon times, VMware ESX storage usage and much more.
The advanced reporting capabilities does not stop there. Goliath allows customers to leverage third-party reporting platforms such as Microsoft Power BI, Microsoft Excel, and Tableau to generate reports. This allows you to take advantage of the features and capabilities of these platforms to generate your reports. Goliath provides templates and view to jumpstart the use of these reporting platforms.
Summary
The Troubleshooting Workflows, which gives customers real world troubleshooting scenarios including how to solve them, and the ability to auto-cycle NOC view dashboards are my top picks out of this new release. These two features alone help Citrix administrators with various levels of experience troubleshoot issues more effectively, and more proactively monitor their environment(s).
That said, these features continue to enhance an already powerful feature set. Having over 66 reports available out-of-the-box is a great help for an IT administrator, as most likely there will be a report that suits the needs of the business without having to create a custom one. If in the event a custom report is needed, there is helper documentation online and linked to the product itself that can assist with creating your own reports.
The intelligence and automated remediation capabilities are also powerful functions of the product, and allow specific issues to be automatically resolved without a Citrix administrator taking time out of their other important tasks to get involved with troubleshooting.
Many organisations around the world use Citrix ADC (formerly
NetScaler) for load balancing web services, making web services highly
available, offering secure VPN or ICA access to staff and so on. If your
organisation uses Citrix products such as Virtual Apps and Desktops, you
probably also make use of an ADC to provide secure ICA proxy to apps and
desktops, and load balance Citrix and non-Citrix services. The ADC can do a lot
of things, often known as the swiss army knife of networking.
I’ve worked with Citrix ADC for a number of years. Many
people who aren’t too familiar with ADC know it as a remote access appliance, and
load balancer, but that just touches the surface of what ADC is capable of.
I’ve also been certified in ADC for a few years now, holding the “Citrix
Certified Professional in Networking” (CCP-N) certification.
This year I made the decision to pursue the Citrix Certified
Expert in Networking (CCE-N) certification. I had previously attended the CNS-320
course, which helped me obtain the CCP-N.
The CCE-N certification is newer and was only released around a year or so ago. Previously, CCP-N was the limit for Citrix Networking. To obtain the CCE-N certification, I decided to attend the CNS-420 course.
The CNS-420 course covers Networking Assessment, Design, and
Advanced Configuration for Citrix ADC deployments. In my past experience, I’ve
come away from Citrix courses not only knowing more about the product, but also
things I did not think were possible with ADC, and ideas that I can transfer
into my organisation.
The course starts out explaining in advanced form the
methodology Citrix Consulting applies to all their new ADC deployment projects
with customers, and how you can use the same methodology for your customers to
be successful with your ADC deployments. You are taught the different types of
ADC platforms available for private and public cloud, the different ways an ADC
can be deployed, and the different configurations that can be applied based on
business drivers and priorities, with example scenarios included.
Further on in the course, you delve into advanced coverings
of security by covering topics such as Authentication, Authorization and
Auditing, implementing Endpoint Analysis, Application Firewall to protect your
business applications from zero-day attacks, Quarantine Groups and more. This
part of the course was very beneficial given how important security is in
today’s world.
Load Balancing and Global Server Load Balancing is covered
in detail which gives you the knowledge you need to scale web servers for performance
and design a multi-datacentre global load balancing solution. Citrix Gateway is
also covered, and you will learn how to deploy Gateway to provide users ICA
proxy access to their virtual apps and desktops, provide VPN access, deploy RDP
Proxy, or Clientless Access. You will also learn how to secure the environment
using Smart Access, pre-authentication policies, authentication policies, and
more.
As a summary, I’ve listed below some of the items I found
most interesting in the course. Those I think would be beneficial to other
potential students:
The Citrix methodology and how to ensure a
successful deployment of ADC. You will understand how to identify and work with
an organisation’s key stakeholders, discover the key business drivers, analyse
the organisation’s existing infrastructure and design an ADC solution that will
successfully meet the needs of the organisation, within the time and budget
allocated.
Discovering the different types of ADC, from VPX
to MPX, SDX, and CPX. You will discover the benefits of each appliance, and
under what conditions one variant will make more sense over another.
Understanding the public cloud offerings for ADC is also beneficial as many
organisations are considering making a move to cloud for services such as the
ADC.
The security features on offer from ADC. How to
deploy Secure Web Proxy to protect your users from browsing to malicious
websites or non-productive websites, Application Firewall to protect against
SYN flood attacks, DDoS attacks, zero-day attacks and more, and AAA virtual
servers’ capabilities that can provide multiple factors of authentication
before users are allowed to access backend systems. These are just some of the way’s
ADC can protect your business applications.
Advanced Gateway configurations. Deploying and
configuring RDP Proxy, which allows RDP traffic from internet locations to be
securely proxied to corporate servers. Clientless Access, Smart Access
policies, VPN access including split tunnelling and more.
Hopefully this review is helpful for you, and I encourage
those who work with ADCs daily and who already hold the CCP-N qualification, to
begin pursuing the CCE-N certification.
Integrating reCAPTCHA by Google with Citrix ADC is a great move towards protecting internal resources from attackers. If someone or even a bot of computers are trying to brute force an account, or break in to your system, having reCAPTCHA is sure to defer such activies and make it a very difficult task to achieve.
Note: This article describes the methods to configure reCaptcha on Citrix ADC running firmware version 12.1 build 50.28 or higher. For methods on newer builds, see here.
In this post, I’ll describe how you can place reCAPTCHA in the first line of authentication with WebAuth, and LDAP as the second factor. This is all using nFactor for ADC Unified Gateway which was released in versions 11.1. I’ve previously described how you can use RADIUS, LDAP and Azure authentication technologies with nFactor to create a dynamic real-time authentication system. You can read more about that here https://www.jgspiers.com/nfactor-authentication-with-netscaler-gateway/
Select reCATPCHA V2. Specify a descriptive label and enter your domain name which will be the FQDN of Citrix Gateway.
Note: Invisible reCAPTCHA has not been released for GA so do not choose this.
Agree to the ToS and click Register.
You’ll be given a Site key and Secret key. Keep these secure and safe, you’ll need them later.
Log on to ADC using a program such as WinSCP and create a new Login Schema file. This file will generate the UI users see when logging on to ADC, containing the reCAPTCHA box and a username field. The username is extracted and placed in the next Login Schema for LDAP authentication. Login Schemas that you create should reside in /nsconfig/loginschema/.
The XML code you need is here, take a copy:
<?xml version="1.0" encoding="UTF-8"?>
<AuthenticateResponse xmlns="http://citrix.com/authentication/response/1">
<Status>success</Status>
<Result>more-info</Result>
<StateContext></StateContext>
<AuthenticationRequirements>
<PostBack>/nf/auth/doAuthentication.do</PostBack>
<CancelPostBack>/nf/auth/doLogoff.do</CancelPostBack>
<CancelButtonText>Cancel</CancelButtonText>
<Requirements>
<Requirement><Credential><ID>login</ID><SaveID>ExplicitForms-Username</SaveID><Type>username</Type></Credential><Label><Text>User name:</Text><Type>plain</Type></Label><Input><AssistiveText>Please supply either domain\username or user@fully.qualified.domain</AssistiveText><Text><Secret>false</Secret><ReadOnly>false</ReadOnly><InitialValue></InitialValue><Constraint>.+</Constraint></Text></Input></Requirement>
<Requirement><Credential><ID>saveCredentials</ID><Type>savecredentials</Type></Credential><Label><Text>Remember my password</Text><Type>plain</Type></Label><Input><CheckBox><InitialValue>false</InitialValue></CheckBox></Input></Requirement>
<Requirement><Credential><ID>nf-recaptcha</ID><SaveID>ExplicitForms-Username</SaveID><Type>nf-recaptcha</Type></Credential><Label><Text>Captcha:</Text><Type>plain</Type></Label></Requirement>
<Requirement><Credential><Type>none</Type></Credential><Label><Text>Please enter your username and verify captcha</Text><Type>information</Type></Label><Input /></Requirement>
<Requirement><Credential><ID>loginBtn</ID><Type>none</Type></Credential><Label><Type>none</Type></Label><Input><Button>Log On</Button></Input></Requirement>
</Requirements>
</AuthenticationRequirements>
</AuthenticateResponse>
Now add a Login Schema Profile to ADC. Log on to the GUI, navigate to Security -> AAA – Application Traffic -> Login Schema -> Profiles -> Add.
Specify an appropriate name and click on the edit button under noschema.
Select the Google Captcha Login Schema. Click Select.
Click Create.
Next create a Login Schema Policy. Click the Policies tab -> Add.
Specify an appropriate name, under Profile choose the Login Schema Profile you created. Under Rule enter true. Click Create.
Edit your AAA vServer and bind the Login Schema directly to this server. I’m assuming you have already created the AAA vServer, Authentication Profile and other parks to use nFactor. If you have not, use the link at the top of this post for guidance. This Login Schema will now apply to all users logging on to my ADC. This is the first schema/UI that will be shown to users.
We need another Login Schema, this is for the second factor using LDAP. The Login Schema contains a username and password box, however the username is extracted from the previous WebAuth/reCAPTCHA schema. Create a new Login Schema file as below.
The XML code you need is here, take a copy:
<?xml version="1.0" encoding="UTF-8"?><AuthenticateResponse xmlns="http://citrix.com/authentication/response/1"><Status>success</Status><Result>more-info</Result><StateContext /><AuthenticationRequirements>
<PostBack>/nf/auth/doAuthentication.do</PostBack><CancelPostBack>/Citrix/Authentication/ExplicitForms/CancelAuthenticate</CancelPostBack><CancelButtonText>Cancel</CancelButtonText>
<Requirements><Requirement><Credential><ID>login</ID><SaveID>ExplicitForms-Username</SaveID><Type>username</Type></Credential><Label><Text>Username</Text><Type>plain</Type></Label><Input><AssistiveText>Please supply either domain\username or user@fully.qualified.domain</AssistiveText><Text><Secret>false</Secret><ReadOnly>true</ReadOnly><InitialValue>${HTTP.REQ.USER.NAME}</InitialValue><Constraint>.+</Constraint></Text></Input></Requirement><Requirement><Credential><ID>passwd</ID><SaveID>ExplicitForms-Password</SaveID><Type>password</Type></Credential><Label><Text>Password:</Text><Type>plain</Type></Label><Input><Text><Secret>true</Secret><ReadOnly>false</ReadOnly><InitialValue/><Constraint>.+</Constraint></Text></Input></Requirement>
<Requirement><Credential><Type>none</Type></Credential><Label><Text>Please enter your password</Text><Type>confirmation</Type></Label><Input /></Requirement>
<Requirement><Credential><ID>saveCredentials</ID><Type>savecredentials</Type></Credential><Label><Text>Remember my password</Text><Type>plain</Type></Label><Input><CheckBox>
<InitialValue>false</InitialValue></CheckBox></Input></Requirement><Requirement><Credential><ID>loginBtn</ID><Type>none</Type></Credential><Label><Type>none</Type></Label><Input><Button>Log On</Button></Input></Requirement></Requirements></AuthenticationRequirements>
</AuthenticateResponse>
Create another Login Schema Profile for the username extraction piece as shown below, using the XML file you created. You don’t need to create a Login Schema Policy.
Next create a Policy Label for the second LDAP factor. Navigate to Security -> AAA – Application Traffic -> Policies -> Authentication -> Advanced Policies -> Authentication Policy Labels -> Add.
Enter a name, under Login Schema choose the Username Extract Login Schema you just created. Click Continue.
Click on Click to select under Select Policy.
Bind your LDAP policy, if you don’t have one, create one first. Click Select.
Under Goto Expression select END. No other factors will be used. Click Bind.
Click Done.
Next navigate to using WinSCP or similar, navigate to var/netscaler/logon/LogonPoint/custom on ADC. Edit the script.js file and enter the following JavaScript code:
Note: Replace the key beside var reCaptchaSiteKey= with your own Site key.
/*
* Custom credential handler for Google ReCaptcha.
* If a credential of type "nf-recaptcha" is sent in any factor, this code
* will be executed. The "submit" button of the form will be disabled
* by default until the CAPTCHA is completed correctly.
*
* Use with the below WebAuth action:
* add authentication webAuthAction recaptcha -serverIP <IP Address of google.com> -serverPort 443 -fullReqExpr q{"POST /recaptcha/api/siteverify HTTP/1.1\r\n" + "Host: www.google.com\r\n" + "Content-Type: applica
tion/x-www-form-urlencoded\r\n" + "Content-Length: 10000"+"\r\n\r\n" + "secret=<Secret key from Google Recaptcha>&response=" + http.req.body(10000).after_str("&recaptcha=")} -scheme https -successRule "http.RES.body(1000).REGEX_MATCH(re/
\"success\": true.*\"hostname\": \"<FQDN of the Gateway/Auth vServer>\"/)"
*
*/
CTXS.ExtensionAPI.addCustomCredentialHandler({
                  getCredentialTypeName: function () { return "nf-recaptcha"; },

                  getCredentialTypeMarkup: function (requirements) {
                                    var reCaptchaSiteKey = "6LfAtxoUAAAAAKaGJY2RO7QGLBM8BRcQDf5dACaG"; //Replace this with the SiteKey from Google ReCaptcha
                                    var div = $("<div></div>");
                                    var CAPTCHA = $('<div id="g-recaptcha" class="g-recaptcha" data-callback="captchaSuccess"></div>').attr("data-sitekey", reCaptchaSiteKey);
                                    var input = $('<input id="captchaResponse" name="recaptcha" type="hidden" value=""/>');
                                    div.append(CAPTCHA, input);
                                    var script = document.createElement("script");
                                    script.type = "text/javascript";
                                    script.src = "https://www.google.com/recaptcha/api.js";
                                    script.onerror = function(){
                                                      var $form = $(".credentialform")[0];
                                                      var fieldDiv = $('<div class="field CredentialTypenone"></div>');
                                                      var leftDiv = $('<div class="left"></div>');
                                                      var label = $('<div class="standaloneText label error" role="alert"></div>').text("Could not load Google ReCaptcha. Please contact your administrator.");
                                                      leftDiv.append(label);
                                                      fieldDiv.append(leftDiv);
                                                      $($form).append(fieldDiv);
                                    };
                                    $("head")[0].appendChild(script);

                                    $(document).on('ctxsformsauthenticationdisplayform', function (e, data) {
                                                      var $form = data.authenticationElement.find('.credentialform');
                                                      var $CAPTCHA = $form.find('#g-recaptcha');
                                                      $loginButton = $form.find('#loginBtn');
                                                      if ($CAPTCHA.length && $loginButton.length) {
                                                                        // This is a CAPTCHA form
                                                                        // Disable the submit button by default
                                                                        disableFormsButton($loginButton);
                                                      }
                                    });

                                    return div;
                  }
});
/* End ReCaptcha code */

var $loginButton;
function captchaSuccess(data) {
        $("#captchaResponse").val(data);
        enableFormsButton($loginButton);
}

function disableFormsButton($button) {
        // Disable the button and stop it appearing clickable
        $button.addClass('disabled').removeAttr('href');
}
function enableFormsButton($button) {
        // Enable the button and make it clickable again
        $button.removeClass('disabled').attr('href', '#');
}
Navigate to Security -> AAA – Application Traffic -> Policies -> Authentication -> Advanced Policies -> Actions -> CAPTCHA -> Add. The CAPTCHA policy is used for reCAPTCHA verification with Google.
Enter an appropriate name, the Server URL should resolve to https://www.google.com/recaptcha/api/siteverify. The Secret Key and Site Key will be what Google provided to you. Click Create.
Now, from CLI, run command add authentication policy GoogleRecaptcha -rule true -action GoogleRecaptcha.
Navigate back to the AAA vServer and add a new Authentication Policy.
Select the CAPTCHA policy as first factor, choose the LDAP Only/Username Extracted Policy Label for Next Factor. Click Bind.
Your Authentication Policy should look like this. It’s time to test it out.
When navigating to Citrix Gateway, the first Login Schema CaptchaLoginSchema displays with a username and captcha field. Enter your username and then tick I’m not a robot.
You will be challenged to select a number of specific pictures, in my case, there was nothing to select so I clicked SKIP.
Next I was challenged to select all squares with a street sign. Click VERIFY.
Captcha verification is complete and you’ll be able to continue to the next factor. Click Log On. At this stage, the username you entered will be captured and fed through to next factor. You could in theory do something such as Group Extraction or other methods and apply many different factors based on who the user is.
In my case, I’m only selecting LDAP. Notice the second Username Extract Login Schema now shows, with my username extracted from previous factor. Enter password and click Log On.
The Extended Support end-date for XenApp 6.5 is just under
two months away, so the remaining customers, which I expect to be a fair few,
should be on their migration journey to the Flexcast Management Architecture versions
of Virtual Apps and Desktops 7.
We should take a moment to firstly identify the different types of customers and where they are on their Citrix Virtual Apps and Desktops journey. I like to group them in to three categories:
The XenApp 6.5 Customers:
The XenApp 6.5 customers that remain on that version for reasons such as:
It just works, and the customer has been reluctant to move to VA&D 7 in case it did not perform as well.
Missing features available in XenApp 6.5 but not available in VA&D 7. Thankfully Citrix has filled the gap in this regard, not to mention the many more features now in VA&D 7.
Having to retrain staff on the Flexcast Management Architecture is a challenge and has delayed the transition to VA&D 7. The components that make up a VA&D 7 site do behave different, but many components have not changed a great deal from 6.5.
Budget constraints, as to support a new upgrade version, there is normally a requirement to invest in new virtualisation hardware, storage, and software licenses such as for new Operating Systems.
Concerns around how IT support can affectively troubleshoot in a Virtual Apps and Desktops 7 environment, as there has been change in the architecture and components.
The 7.x Long Term Service Release (LTSR) Customers:
The 7.x Long Term Service Release customers that remain on such a version for reasons such as:
The customer does not have the staff numbers or time to keep upgrading to the latest versions of Virtual Apps and Desktops.
The customer does not want to risk the disruptions that an upgrade has the potential to bring, such as new types of faults leaking into the environment, slower performing logons, or a worsened in-session user experience.
The customer wants to remain on a stable version and not risk introducing new code to the environment that could be unstable.
The customer has no interest in new features at this time, and the current LTSR version offers all that they need.
The 7.x Current Release (CR) Customers:
The VA&D 7 Current Release customers remain on such a version for reasons such as:
The customer needs the latest features released by Citrix, as it allows the customer to be more competitive in their market.
The customer has a well-defined upgrade strategy that minimises user disruption and can be executed easily.
The customer has the staff skilled to perform frequent upgrades and they are well equipped with tools such as monitoring products to capture analytics and troubleshoot the environment effectively.
Either way, if a customer is still on XenApp 6.5, LTSR or
the Current Release of Virtual Apps and Desktops, at some time sooner or later
the environment will need to be upgraded.
Stepping aside from Citrix upgrades and looking outside of
the Citrix stack allows us to remember that every other component used to
support your application or desktop virtualisation deployment will need to be
maintained and not left stagnant. That is, from your bare metal hypervisor
hosts, to the network and storage fabrics, Operating Systems, SQL server
versions, and the applications that users’ interface with every day.
The problem the IT team and organisation face is that with
upgrades to any infrastructure hardware or software component, it can result in
a degraded end-user experience, or it could introduce new types of faults into
your environment. This is where monitoring software can aid your deployments
and help ease those deployment pains.
Investment in purpose-built troubleshooting and monitoring tools helps with deployment pains:
A monitoring solution is just what you need to aid your upgrades
from XenApp 6.5 to 7, or from VA&D 7 versions to later releases. Here are
three key benefits you can gain from having a monitoring solution in place:
Baseline the environment before and
after upgrades.
Baselining allows you to compare the performance of your
infrastructure when it is working as it should, and then after you complete an
upgrade to a newer version of Virtual Apps and Desktops. You can also extend
the baselining to hardware refreshes, Operating System upgrades, 3rd
party software upgrades and more. This allows you to determine if any change to
the environment has had an impact on performance.
Baselines should be focused to include logon times,
application launch times, virtual machine resource consumption, and resource
consumption against your hypervisors, storage and network.
Monitor both old and future environments from a single pane of glass.
During a Virtual Apps and Desktops upgrade, there is going
to be a time where you will have users launching resources from both old and
new environments. More typically in an enterprise environment will you stage
the upgrade. This allows you to carefully plan and execute your upgrades,
without putting too much pressure on your team and causing mass-disruption to
end-users.
With a monitoring product that is able to monitor both environments at the same time, you will have the advantage of being able to effectively monitor and troubleshoot both environments from a single console, as let’s face it, the priority of the old environment should not decrease until the last user has been migrated off it.
Monitor both old and future environments from a single pane of glass.
Your end users are the key to a successful deployment. If your end-users frequently experience issues during or just after the deployment of a new version of Citrix Virtual Apps and Desktops, management may delay.
Leverage historical reports to continually monitor and trend use and performance over time.
To anticipate and prevent future issues, it is critical to trend and watch performance over time so that you can foster data driven conversations on how and where you can make future performance improvements and ensure performance degradation does not slowly happen over time.
Goliath Performance Monitor (GPM):
The three
key benefits I spoke about can be delivered by a monitoring solution such as
Goliath Performance Monitor, and the Application Availability Monitor products.
Application
Availability Monitor (GAAM) is a synthetic application availability tool that
can simulate the launching of applications or desktops in your Virtual Apps and
Desktops environments, mimicking a real user session launch. Simulations are
automatically performed at set times chosen by you, and simulations launch a
resource just like an end-user would. This synthetic logon process tests
StoreFront logins, authentication, application enumeration, session launch, and
more, including capturing the time it takes for each step to complete.
These steps
play a direct part in the success of a Virtual Apps and Desktops upgrade. If
they are much slower after an upgrade than they previously were, delays to the
upgrade may be inevitable as user feedback would be poor and adoption is likely
to be low.
Having a
tool like GAAM running in your current environment allows you to capture a
baseline for many of the workflows an end-user goes through every day, and you
can compare that baseline with an upgraded version of Citrix Virtual Apps and
Desktops. This is further achieved by the historical reporting capabilities of
the product.
The results
of GAAM are fed into the Goliath Performance Monitor system and can be used for
historical reporting as mentioned. This system monitors your Citrix components
such as the Delivery Controllers, VDAs, and StoreFront servers. It can also
monitor multiple versions, solving the key benefit of monitoring your XenApp
6.5 environment and VA&D 7 environment at the same time.
However, it also goes beyond just Citrix. GPM
can monitor your hypervisor hosts, the virtual machines that run within them, your storage platform, the networking
stack, and end-user specific experiences such as real user logon times,
in-session performance and more. This allows you to even benchmark hypervisor
performance before and after a hardware refresh, or virtual machine resource
consumption after an Operating System upgrade.
Above is a screenshot of the summary information composing the user experience dashboard that provides information and metrics about the user’s specific published app/desktop or virtual desktop session making it easier to troubleshoot when issues arise.
Going beyond benchmarking for upgrades, the capturing and
archiving of all this data can assist with your capacity planning for future
upgrades without the need to guess.
Whilst on a normal day the solution keeps check on your
infrastructure, the early warning system provided by Goliath Performance
Monitor makes sure that you are alerted to problems before an end-user
experiences them, or the problems become more widespread within the business
affecting multiple users. This delivers the third key benefit of solving issues
before an end-user notices and tickets are opened with the helpdesk. There is
also the capability of self-healing, allowing problems to automatically be
remediated without manual intervention from the IT administrators.
Summary:
Software vendors such as Citrix are innovating at a rapid
pace, bringing new versions of their products out every quarter. This speed of
release means that customers will find themselves upgrading more frequently
than they ever did before, which is often warranted to make use of new
functionality and stay current, however it does bring a risk to the end-user using
the platform you are upgrading that they may not get the same user experience
they have become used to expecting. That experience can be calculated by
performance or by hard or soft errors encountered.
With a monitoring tool like GPM, you get a wrath of
information about a user’s session experience when they are connected to a
virtual application or desktop. That information is saved and available for
historical reporting.
GPM also provides information about your virtual machine’s
performance, the network performance, and hypervisor performance. You can see
things like how much CPU is being consumed on a hypervisor host or what process
in a virtual desktop is taking up too much memory.
If an IT administrator takes a call from an affected user,
direct from the GPM console you can see the client’s IP address, logon time,
Citrix Receiver version, what time they connected, their session latency and so
much more. Having information like this readily available and at your
fingertips empowers the IT service desk and results in support incidents being
resolved faster.
All of these capabilities will undoubtably help
you during those upgrades that will happen sooner rather than later. They will
also continue to help once the upgrade is successful, ensuring that you not
only deliver a performing solution from the beginning, but during the full life
of the environment.
Whether you’re still in the planning stages or in the middle of a phased roll-out, here is a free migration guide, written for IT professionals by IT professionals that will give you all the technical details you need to ensure a seamless migration and a positive end-user experience.
eG Enterprise from eG Innovations, a Global Technology
Partner for Citrix, is an end-to-end monitoring solution that amongst many
other technology products, monitors the Citrix Virtual Apps and Desktops stack
of components, including the underlying storage, hypervisors and network.
Last year I had a look at the 6.3 version of the product.
Now, eG Innovations have release their latest version, eG Enterprise v7.
I wanted to take another look at the product as a whole and
investigate what is new and improved where it relates to Citrix Virtual Apps
and Desktops monitoring.
Organisations that run deployments of Citrix Virtual Apps
and Desktops want to make sure that their users receive the best experience
possible. A great user experience in relation to this is fast application and
desktop launch times, fast logons, a responsive system, and one that rarely
encounters any errors. Take these experience factors and think about how users
expect to have them wherever they work from, and from whatever device they work
on.
This is a challenge for Citrix administrators mostly because
the end-user no longer works from one device or from the same office. The
office today consists of multiple devices and multiple locations, often outside
of the organisations control.
This is why monitoring products like eG Enterprise have focused their product updates around helping with these challenges. The information and data you receive from the product aid you in the efforts you make to ensure that your users receive the best experience possible when they interact with published applications and desktops.
Simplified Installation Process
The first thing you will come across is the installation
process. You could say it is broken up into three sections:
Install the product
Provide database information
Provide license file
The process is simplified. After installing the product, you
specify database information such as your database server name, port, database
name and credentials. There also is a new validation feature which allows you
to validate the database configuration before proceeding. Previously, this was not
possible, and if anything was incorrect the installer would proceed, but the
install would then fail if the configuration was incorrect, prompting you to
start again.
During the installation configuration process, you also can
configure eG Manager settings such as the password complexity for logon
accounts and your SMTP details. Previously this was only configurable after
installation.
When it comes to uploading your license file, you can use the upload feature of the wizard rather than having to copy the file manually to a directory as per previous version.
Logon Simulator Screenshots
Logon Simulator is a synthetic monitoring tool that launches
connections to applications and desktops during defined times of the day. The
Logon Simulator simulates a real user logging on to StoreFront directly or
through Citrix Gateway and launching an application or desktop. This is all
powered by the lightweight eG Agent which can run on a virtual machine elected
as your simulation machine.
If a logon simulation fails, or is taking a long time, information is fed into the eG Manager dashboard so you can see why. In eG Enterprise v7, information is now also provided with screenshots.
Having a screenshot provides that physical evidence allowing
you to resolve issues faster. In the screenshot above, we know a simulation has
failed with the message “Cannot start app”. I might then at this stage to go
looking at the VDAs hosting this application to make sure they are online and
registered. The logs and text-based information is still there and available
from the console should you need it.
Having screenshot evidence is something that I think will help eG Enterprise customers troubleshoot faster.
Full Session Simulation
Why settle for the testing of user logons when we can also
test real user workflows! You see, in reality, user logons are just part of the
overall experience. eG Innovations recognise that the user experience does not
end there.
Users will open various applications and then perform
multiple transactions with those applications. eG Enterprise is able to test
these workflows by performing the same transactions, closing and then logging
out of the Citrix session.
This is possible with the Full Session Simulator. With this
feature, you can test the whole logon process as you did before, but further go
beyond and test additional tasks such as opening and authenticating to a SaaS
application via your web browser before performing other tasks. The time it
takes, and the success of those workflow actions are also recorded and stored
for reporting purposes or real-time viewing.
If you receive a failure, a screenshot is given as evidence
to the IT administrator for easier and quicker troubleshooting of a problem.
In eG Enterprise v7, a new UI has been released for the Full
Session Simulator, which shows each transaction that has been tested by the
Full Simulator, including the success and time taken to complete the
transaction.
This provides in-depth information in a super easy to read format, which gives IT administrators the power they need to troubleshoot a user experience which is not what a user expects, and not one you aim to deliver.
New Interactive Session Logon Processing Times
In addition to synthetic monitoring capabilities, eG
Enterprise also provides in-depth real user experience monitoring. By
monitoring the session experience of every user connecting to the Citrix Site
in real time, Citrix admins can easily identify issues and troubleshoot them
quickly. A combination of synthetic and real user monitoring is needed in a
Citrix monitoring solution.
eG Enterprise already provided deep visibility of the Citrix
logon process covering visibility both from the Delivery Controller and the
Virtual Apps Server / Virtual Desktops VM. To expand the visibility further, eG
Enterprise v7 now reports on the Interactive Session phase of the logon process,
which is made up of three sub-phases.
Pre-userinit – Overlaps with Group Policy Objects and logon scripts configured through Group Policy. If this portion of the logon process is high, consider investigating your Group Policy Objects and logon scripts that may be applying to the affected session(s).
Userinit – The time it takes userinit.exe to run logon scripts, establish network connections and start explorer.exe. This step can be high if there are network issues, connectivity issues to Domain Controllers or corrupt logon scripts defined.
Shell – The time taken from userinit starting the Windows user interface, and keyboard/mouse control being handed to the user. Can be high due to an overloaded VDA, or an under provisioned desktop, or too many processes set to start at logon etc.
Being able to report on these phases of the logon process gives the Citrix Administrator more power and more ability to be able to effectively identity and troubleshoot slow logons for one to many users.
New Citrix Cloud Logon Processing Times
Many customers are opting to use Citrix Cloud and the
Virtual Apps and Desktops Service. With this service, your control plane
resides in Citrix Cloud and is managed by Citrix.
Whilst traditionally eG Enterprise collected the logon duration metrics for on-premises Delivery Controllers, this new release sees the Citrix Cloud Delivery Controller metrics captured, now known as the Citrix Cloud Site component in eG Enterprise.
Local Host Cache (LHC) Activation Status
Local Host Cache offers continuity whilst your Delivery
Controllers have lost access to the SQL database. Under such circumstances,
users can still connect to their applications and desktops just as they
normally would.
However, whilst Local Host Cache is there to protect against
such failures, as an organisation you should monitor and be alerted on when
Local Host Cache is used and understand the performance of Local Host Cache
when it is used.
eG Enterprise helps with this by monitoring if Local Host Cache is active or not in your environment, and how long it was active for. This can be important to identify if there are underlying connectivity issues between the SQL servers and Delivery Controllers.
I think this capability will be gratefully received by Citrix administrators, as it allows the health of your database communication to be kept on top off.
User Input Delay
The user experience is greatly determined by the amount of
delay between a mouse click or keystroke. That is why in this edition of eG
Enterprise, a new User Input Delay metric is captured and reported on. eG
Enterprise v7 reports user delay from three perspectives:
Application/Process: How long it took the
application/process to respond to a user’s request/action during a session.
User Session: How much of a delay exists in the session to respond to a user’s request/action.
The Virtual Apps Server: Reports which user session had the maximum user input delay, and the average delay across all user sessions on this server.
Essentially with User Input Delay, the time it takes for a
user request to be picked up by a process or session is measured. For example,
maybe a user is typing in Word, or clicking to launch an application or file.
When this happens, the request is queued before being picked up by the Kernel
in the OS for processing.
Virtual machines that are constrained for resource are an
obviously example of why the user input would be delayed.
User Input Delay is supported on Windows Server 2019 and above Operating Systems.
Citrix ADC License Monitoring
Licensing can be hard to keep track of and maintain. You have licenses for Microsoft products, your Citrix Virtual Apps and Desktops deployments, Citrix ADCs and various other products. eG Enterprise v7 allows you to keep track of your Citrix ADC licenses, displaying the license expiry date and to which ADC the license is applied, all direct from the eG Manager console. With licensing information made easily available, you can manage renewals correctly in good time.
Support for Citrix App Layering
Citrix App Layering works by way of layering different parts
of the virtual desktop. You have your base OS layer, and one to many App layers
which sit on top, followed by the Platform layer. This layering aspect allows
you to independently manage different parts of your desktop image and more
easily tailor desktop deployments to your end-users.
For example, your OS layer contains just the Windows Operating System and patches. You can then have an App layer for Microsoft Office and a second App layer for Google Chrome. If one user only needs Chrome, you build a desktop from the Enterprise Layer Manager (ELM) containing just the OS layer and Google Chrome App layer. If a user needs both Google Chrome and Microsoft Office, you build a second desktop with those two App layers, and the same OS layer. There is no need to build a new OS layer, or “gold image”.
In addition, a layer-on-demand feature called Elastic
Layering allows an App layer to be delivered to a user as that user logs on.
The layer, which is a virtual disk, mounts to the user’s virtual desktop before
or after logon.
With the benefits of App Layering and the increasing number
of organizations deploying it, eG Innovations has released support for Citrix
App Layering, allowing you to monitor the technology.
From the eG Enterprise dashboard, you can see how long it
takes to mount Elastic Layers. Given that logon times are top of mind for
Citrix Administrators and end-users alike, an Elastic Layer does have the
potential to impact logon times, so it is useful to get these statistics from a
centralised dashboard.
From the eG Enterprise dashboard, you can also see which disks are mounted to the user’s virtual desktop, including the disk filename and location.
Support for Citrix Workspace Environment Management
WEM (for short) to me is another one of those technologies
which was a welcomed addition to the Citrix family of products. This is
Citrix’s User Environment Management tool. With WEM, you can map printers,
registry objects, network drives, applications and so on to a user’s desktop
session after they have logged on, rather than during logon. This provides a
faster user logon which is satisfying to an end-user, and the business.
On top of logon optimisation and session customisation, WEM
can also control the behaviour of application processes in respect to how much
RAM and CPU they consume.
eG Enterprise v7 is now WEM-aware. The product is able to
calculate how long it takes for the WEM Agent to process. A slow or stalled
Agent will mean that an end-user may not be receiving their entire
configuration set. For example, they could be missing a network drive or
printer completed which was due to be delivered by the WEM Agent, or there may
be a delay. Ultimately, Citrix Administrators will want to know before a call
is logged to the helpdesk.
Beyond Agent processing times, eG Enterprise also monitors
WEM connectivity back to the database, license server connectivity, and more.
With a large number of customers deploying WEM into their environments, it becomes an important piece of infrastructure that needs to run optimally at all times. I like that eG Innovations have realised that and spent time developing monitoring capabilities for WEM.
Support for Citrix Federated Authentication Service
Another Citrix product, and another one eG Innovations have
released support for in eG Enterprise v7, which is fantastic.
Citrix FAS (for short) opens up your Citrix deployment to be
used with many different authentication providers using SAML. With SAML,
end-users can authenticate to a third-party provider without having to supply a
password.
The third-party authentication provider can be a trusted
entity to Citrix Gateway or StoreFront, and this allows FAS to become involved
and issue a user-certificate to the user authenticating, which is presented to
the virtual application or desktop to complete Active Directory authentication.
With support for FAS, you can now install an eG Enterprise agent on the FAS server to begin collecting information such as the certificate which was issued to a user including certificate thumbprint and expiry date, or the error that prevented a certificate from being issued.
You can also see metrics for FAS such as the total number of certificates requested, the load on the FAS server, how many seconds a certificate request took and more. This information is important to maintain a healthy and optimal deployment of FAS.
Remote Control Actions
If your helpdesk staff can be fuelled with need-to-know
information and a powerful toolset, they will be able to resolve tickets
quicker and more effectively.
A monitoring solution such as eG Enterprise already fuels
the helpdesk with detailed information on the performance and health of your
network, storage, hypervisors and virtualised platforms. Going further than
this, the Remote Control Actions functionality within the product further
powers helpdesk staff by offering many different actions that can be executed
at the click of a button:
Reboot the system
Last boot time
Execute command
Logoff a session
Shadow a user session
List printers in a user session
Get screenshot of a user session
Start & Stop a service
Show IP configuration of the system
The above are just some of the actions available at the click of a button, all from within eG Manager. There is no need to jump between different management consoles just to get the information you need to resolve an end-user reported issue. Having the ability to get what you want using the least amount of effort is at times invaluable.
New Dashboards
Dashboards provide text-based data visually so that we can
more easily understand what is going on in our environment at a quick glance.
eG Innovations have release three new dashboards in particular that will help
you monitor effectively:
User Session Topology
The User Session Topology dashboard is made up of useful information about an active user session. If a user calls in to report a problem, you can easily search for their session and immediately see through a single page what their HDX/Network latency is, how long they have been actively using their session, their profile size, what VDA they are connected to, what Delivery Controller brokered their connection, logon duration information, session information such as the end-device IP address and more.
Geo Maps
I’ve spoke before about troubleshooting techniques and how going through process of elimination or identifying trends will allow you to troubleshoot issues faster. The Geo Maps dashboard is another tool that will help you do just that. With Geo Maps, you can get a high-level view of where the Citrix sessions are connecting from. If there is a problem in a specific region for example slow sessions, you can identify it pretty quickly with less effort.
Citrix ADC Load Balancing Request Flow
Without having to log on to a Citrix ADC and spend time
identifying the traffic flow, eG Enterprise displays that information for you
so that you can trace the flow of traffic as a user connects through a load
balancing virtual server hosted by ADC.
Not only that, you also get a view of the health status of the virtual servers, services and ADC nodes, all from a single easy to view page. I think this is an excellent dashboard and a well-received addition to eG Enterprise.
New Reports
With dashboard also comes new reports. eG Enterprise v7
ships with three new reports you can produce for your management team, or for
your own operational benefit.
Citrix Virtual Apps Overview Report
This report has multiple tabs for specific information on user sessions, applications, events, servers and licenses. However, there is a User Experience tab which gives a breakdown of the logon duration across a period of time, the application launch times, HDX latency minimum, maximum and average, and also the top users by logon duration and HDX latency etc. All the metrics are nicely laid out across pie and bar charts and can be clicked on for more granular analysis.
Capacity Planning Report
Noticing that more and more users are finding their way to
your published desktops and applications? Sure, it is always good to see the
adoption of the technologies you have in place, but if you don’t keep track of
usage patterns your end-users could overload the hardware you have provisioned
in the datacentre to run your virtual apps and desktops. Overloaded hardware in
terms of the hypervisor, network and storage will result in a negative user
experience as user sessions contest for resources.
With the Capacity Planning Report, you can easily see trends over time in relation to how many user sessions you have active, the number of sessions completed, the CPU, memory, disk and network consumption. These recorded metrics allow you to plan for the future and scale your hardware up (or maybe even down) according to usage, all before it is too late.
Capacity Prediction Report
Capacity prediction is often hard to gauge. How many servers
will I need if 10% more users concurrently connect to my virtual apps and
desktops over the next year, or year on year? If my organisation makes an
acquisition, how do we capacity plan appropriately to make sure the new staff
are given the same experience as the current staff?
eG Enterprise can help with the new Capacity Prediction Report, which based on a controlled slider will tell you if your concurrent sessions did increase by 10% for example, what extra CPU, disk, network, and memory would be consumed. The report also gives you the number of additional servers you would likely need to support that extra load. The predictions are calculated based on the historical resource usage collected within your environment over time, so the product certainly holds a good amount of valuable information it needs to make capacity predictions.
Summary
eG Innovations has invested heavily in the Citrix monitoring
space so that you can deliver the best experience possible to your end-users
wherever they are and from whatever device they use. With a host of support for
new features and products, user experience focused metrics, dashboard
enhancements, new reports and more, eG Enterprise v7 is now uniquely positioned
to address digital workspace user experience challenges and performance
problems.
This review has only been done from a Citrix standpoint. eG Enterprise provides the same depth and breadth of performance visibility for VMware Horizon too. Additionally, eG Enterprise can be used to monitor enterprise applications, web applications and SaaS applications delivered via Citrix/VMware Horizon. Some new monitoring inclusions in eG Enterprise v7: Docker, Kubernetes, PHP and Node.js web apps, Redis, Hadoop, Office 365, and more. For the full list of new enhancements, you can visit: https://www.eginnovations.com/it-monitoring/whats-new. You can start a free trial of eG Enterprise v7 and evaluate in your Citrix environment based on your Citrix performance monitoring needs.
Why is it so difficule to find the Citrix expertise you need to successfully manage the end-user experience?
It is all in the numbers. And the numbers are not changing anytime soon. Citrix sites support over 400,000 customers.
On average, an organization has 2-3 total FTEs managing and monitoring their Citrix environment. If you take those numbers, then roughly there is a demand for at least 1.2 million experts who need to be able to interact with Citrix in a knowledgeable way. Now on the supply side. We know there are 62 named Citrix Technology Professionals (CTPs) every year who are highly certified. There are then roughly 50-150 Citrix Technology Advocates (CTAs). Harder to quantify is how many additional Citrix experts at varying certifications exist. What I can say is the total supply is far below the demand of 1.2 million. And regionally, it can be even more challenging. Here in Northern Ireland the talent pool supply is much lower than London or major cities in the United States. This means that more often than not organizations using Citrix are under resourced and struggling to find or keep professionals with deep technical expertise.
And if you are a lucky organization with
the right expertise level, my guess is your deep technical experts spend anywhere
from 25-30% of their time troubleshooting basic end-user tickets. This is
critical time taken away from optimizing, managing, upgrading, and supporting
your Citrix environment.
This paradigm isn’t going to change anytime
soon. The only way to change the paradigm is to change the factors. This is
where technology, with embedded intelligence and automation, can augment your
expertise. The right technology solution knows what to monitor, what thresholds
to set, and the right alerts to implement in order to proactively anticipate,
troubleshoot, and prevent performance issues – all without manual intervention.
Citrix Expertise Out-Of-The-Box
All too often Citrix experts are hired to
deploy, manage, and optimize their Citrix Virtual Application and Desktop
environments. But where do they spend their time? They spend it troubleshooting
end-user performance issues and responding to countless support tickets that
come across their desk. The free tools don’t help always help. They often give
only a single view into the Citrix stack, not the broader view to the entire
delivery infrastructure, which includes elements like Active Directory,
Licensing Servers, SQL databases, hypervisors, operating systems, network
connectivity, and more. Now, instead of strategically helping transform the way
people work, the few experts you do have spend their days defending the
technology and its capabilities without the right tools to support them.
This can all be changed by leveraging purpose-built technology that embeds intelligence and automation to proactively anticipate, troubleshoot, and prevent end-user performance issues regardless of where workloads or users are located. Instead of depending on an FTE to constantly put out fires, you can adopt technology that will not only pre-emptively alert you about potential performance issues before users are impacted but can also isolate root cause automatically when issues arise.
Augmenting Existing Expertise
In addition to serving as a full-time
expert, purpose-built technology can uplevel your current staff. Organizations
often hire junior level Citrix talent and invest in growing their skills over time.
There is a way to expedite that timeline by offering visual representations of
performance data correlating key metrics to isolate root cause of issues. This
can alleviate clicking around for hours trying to understand why end users are
experiencing poor performance, instead empowering employees to quickly isolate
the user session (Figure 1) experiencing an issue and quickly identifying what
might be causing the performance lag (Figure 2).
Without a tool that automatically
correlates and ties specific end-user experience data to the complex delivery
infrastructure, admins could waste hours sifting through different systems and
reports trying to recreate specific details of a user session. This even
assumes that the data (event logs, performance data, etc.) exists for the right
time period and user session in question. Even with hours of hunting, administrators
could still come up empty -handed on why an end user is experiencing poor
performance.
Figure 1: This is an example where a monitoring tool
and troubleshooting tool like Goliath Technologies, can offer a view of all virtual desktop
sessions (current and historical) which an administrator can quickly bring up
and sort and search for a user session to confirm that the slowness they are
complaining is real and then drill into the next step to identify why slowness
is occurring.
Figure
2: The image above shows a visual summary, that summarizes a single user
session. At a glance, administrators can quickly get an overview of a single
session’s performance correlating key metrics they may not easily find in
Citrix alone.
Dependency map offers a
quick overview of all components involved in establishing and hosting the
selected Citrix end-user session.
Quick visual breakdown of
all stages of the logon process.
Key performance metrics enable an administrator to quickly view answers
about the performance of a Citrix/VMware session and determine if slowness is
caused by the network or other resources.
A detailed breakdown of
the application usage reveals root cause of a performance issue within an
end-user’s virtual machine.
Retaining Talent
Talent retention is a top of mind topic for
most managers. Good Citrix admins do not want to spend their days reacting to
end-user complaints and fires. They want to invest in the future and be
proactive in the services they deliver. Investment in purpose-built tools
empowers administrators to proactively look for issues before end-users
complain, avoiding support tickets all together from being filed.
Also, key performance reports empower
administrators to foster data driven conversations with other IT team members,
upper management, vendors, and end-users themselves. This avoids hours of
wasting time blaming others for an issue and instead drives factual
conversations and faster resolution times.
Selecting the Right Technology
Now if you are you looking to augment,
uplevel, and support your teams you need to select the right technology. Not
all technology is the same and not all will support the goal of delivering a
“Citrix Expert Out-of-the-Box”. In order to get the complete uplift you are
looking for, you need a solution that offers:
Embedded intelligence and automation to
proactively prevent end-user issues from ever arising.
Broad and deep metrics across entire
IT delivery infrastructure (Citrix, VMware Horizon, Microsoft, IGEL, etc.) and
end-user behavior.
If in healthcare includes visibility across all major EHR
applications.
Historical reports and analytics to foster
data driven conversations with internal IT teams, other vendors, and end users.
These key elements are in fact all part of Goliath
Technologies offerings, for example, and I was lucky enough to get hands-on
experience with this offering after Citrix Synergy 2019. Goliath Technologies offers
software with embedded intelligence and automation for monitoring and
troubleshooting end-user performance issues for environments built on Citrix
Virtual Apps and Desktops or VMware Horizon platforms, whether on-premises or
in the cloud (e.g. AWS, Azure). With the unified view of end-user experience
data across any hybrid landscape, IT is positioned to proactively ensure a
great end-user experience regardless of where end users or workloads are
located.
Summary
When investing in a purpose-built monitoring
and troubleshooting solution, such as the solution from Goliath, it is like
adding a full-time Citrix troubleshooting expert available 24/7/365. And it is an expert that is a trusted resource
helping others on your team from the help desk to other administrators and upper
management.
The Virtual Apps and Desktops service is a Citrix Cloud offering that allows an organisation to host all the backend management components needed to run a Virtual Apps and Desktops site, in the cloud. Not only do the management components shift to the cloud; Citrix install, configure, upgrade, and monitor those components; leaving you to manage the applications, desktops, and data.
To clarify; when an organisation subscribes to the Virtual Apps and Desktops service, the following components that make up the control plane sit within the Citrix Cloud hosted in Microsoft Azure, removing any requirement for those components to reside within your own datacentres:
SQL Server
Citrix Director
Citrix Delivery Controllers
Citrix Studio
Citrix License Server
Citrix StoreFront*
Optionally you can still make use of StoreFront on-premises.
Citrix Gateway*
Optionally you can still make use of your own Citrix Gateway.
Note that all of the above components are highly redundant and scalable, so if your Citrix deployment suddenly expands Citrix will scale and backend infrastructure automatically.
As a result of the above components being within Citrix’s control, all updates and upgrades to new software versions and patching are performed by Citrix. Additionally, hardware requirements to host the components and administration time is reduced and eliminated in some cases.
Update Method
Updates to services in Citrix Cloud such as a new release of the Virtual Apps and Desktops software, are released approximately every three weeks in a rolling fashion. Firstly Citrix internal sites receive the updates, and then updates will be pushed out gradually to customer environments. Delivering updates in this fashion reduces the risk of service impact and maximises availability for Citrix Cloud customers.
VDAs, which remain in the control of the customer, are not updated or upgraded by Citrix.
Resource Locations
Now that we have covered the control plane, the remaining pieces of a typical Virtual Apps and Desktops deployment are of course the applications, desktops and relevant data such as application data and user profiles. All these sit within your control, in resource locations. A resource location is simply a term used in Citrix Cloud to describe the location these pieces can be found. The resource location will also contain access to the domain, the hypervisors that host your VDAs, and optionally StoreFront and/or Citrix Gateway.
A resource location can be one or more datacentres your organisation controls on-premises, hosted in a private cloud running on VMware vSphere or Citrix Hypervisor for example. Alternatively, a resource location can be in a public cloud such as Microsoft Azure, Amazon AWS or Google Cloud (GCP).
Citrix Cloud Connectors
The Citrix Cloud and your resource locations which host the VDAs are connected by using Citrix Cloud Connectors. The Cloud Connector power manages VDA machines and acts as the Citrix Desktop Service registration point for VDAs.
Cloud Connectors will be installed on Windows Server OS machines.
End of public cloud support for on-premises
In March 2020, Citrix announced that from the Virtual Apps and Desktops 7 2003 on-premises release onwards, hosting workloads (VDAs) in public clouds is an unsupported configuration. Customers have the following options:
To be able to host workloads in public clouds, you can leverage the Virtual Apps and Desktops service in Citrix Cloud.
Remain on version 1912 LTSR or the 7.15 version which included up to 5 years of mainstream support.
Citrix Cloud Service Level Agreement
In short, Citrix’s “Service Commitment” is to maintain atleast 99.5% monthly uptime on Services. Monthly uptime is calculated by subtracting the minutes a service was in the state of “Unavailable” during a full month and calculating the percentage, known as the uptime percentage. The uptime percentage measurments exclude downtime that results from things such as regularly scheduled maintenance windows and customer failure to follow configuration guidelines and requirements for the service as documented by Citrix over on Citrix Docs. For more information on Citrix Cloud SLA, see: https://docs.citrix.com/en-us/citrix-cloud/overview/service-level-agreement.html
Technical Security Overview
Firstly, all data flows from Cloud Connectors within each of your resource locations to Citrix Cloud over TLS 443. Traffic is outbound from the Cloud Connector, with no traffic initiating from Citrix Cloud to your resource locations. This simplifies firewall configurations.
The Citrix Cloud control plane will have access to metadata such as usernames, machine names, and application shortcuts. Only the required metadata needed for brokering and monitoring a customer’s applications and desktops is stored by the Virtual Apps and Desktops Service.
Credential Handling
For types of credentials are handles by the Virtual Apps and Desktops service:
User Credentials: For customers continuing to use StoreFront with their Virtual Apps and Desktops service deployment, user credentials are encrypted by the Cloud Connector using AES-256 encryption and a random one-time key generated for each launch. The key does not get passed to Citrix Cloud, but rather returned by the Cloud Connector to Workspace app, and then passed to the VDA by Workspace app where it is used to decrypt the user password during session launch.
Administrator Credentials: When you authenticate against Citrix Cloud, you use the Citrix Online sign-on system. This generates a one-time signed JSON Web Token (JWT) which gives the administrator access to the Virtual Apps and Desktops service.
Hypervisor Passwords: On-premises Hypervisor credentials used for the purpose of machine deployment from the Virtual Apps and Desktops service have a password stored in the SQL database in Citrix Cloud. Peer keys are managed by Citrix to ensure that hypervisor credentials are only available to authenticated processes.
Active Directory Credentials: Machine Creation Services (MCS) uses the Cloud Connector to create machine accounts in Active Directory. The Cloud Connector only has read access to the customer’s Active Directory, so the administrator is prompted for credentials each time they create or delete machine accounts. Credentials to support these operations are only stored in memory and held for a single provisioning event.
A time in which you are asked for AD credentials.
Deprecation of TLS versions
From March 2019, Citrix began blocking communication to Citrix Cloud services over TLS 1.0 and 1.1. For a list of the services affected, see https://support.citrix.com/article/CTX247067
If you have older Receiver versions that need to continue using TLS 1.0 or 1.1, install StoreFront in your resource location(s) and have those Receivers point to it. This forms a design decision.
Customer-managed StoreFront
As previously mentioned, a customer can optionally deploy and use Citrix StoreFront in their resource location.
A customer may choose to do this as StoreFront provides more flexibility for deployment architecture, greater customisation, and increased security.
The other advantage with using StoreFront is that it supports Local Host Cache, so that in the event your Cloud Connectors lose access to the Citrix Cloud control plane, new user sessions are not impacted. Local Host Cache is explained further on in this article.
Citrix Gateway service
The Gateway service is another offering from Citrix Cloud that you can use with your Virtual Apps and Desktops service deployment. Using the Gateway service is an effortless way to provide users with secure remote access to their applications and desktops through Citrix Cloud, and negates the need for you to deploy, configure and manage Gateway within your own datacentres.
When using the Gateway service, you must use Citrix Workspace, which is the Citrix Cloud edition of StoreFront.
There are a couple of considerations to keep in mind regarding traffic flow when the Gateway service is in use. I have gone into more details regarding this further on in this article.
Identity Providers
When you first start out with the Virtual Apps and Desktops service, the provider that authenticates your access requests is Citrix itself. Likely all organisations will move to using a different identity provider, specifically one of the below providers that Citrix Cloud currently supports as of March 2020:
On-premises Active Directory
Active Directory + Token
Azure Active Directory
Citrix Gateway
Okta (Tech Preview)
Citrix FAS is also supported by Citrix Cloud to provide single sign-on to Workspace using Azure Active Directory authentication. Using FAS with Citrix Cloud is currently in Tech Preview, and currently only recommended to be used under testing purposes. For more information see here: https://docs.citrix.com/en-us/citrix-workspace/workspace-federated-authentication.html
Further on in this article, I will show the deployment of Active Directory with token authentication for Workspace.
Extra details on some of the popular identity providers available in Citrix Cloud is documented below.
On-premises Active Directory
Install Cloud Connectors in your domain
From Citrix Cloud, browse to Identity and Access Management
Under the Authentication tab, click Detect. Citrix Cloud should display a Connected message
Active Directory + Token
Citrix Cloud supports using tokens as a second factor of authentication for users authenticating against Workspace using their Active Directory accounts. Users generate tokens using any mobile app that supports the Time-Based One-Time Password standard, such as Citrix SSO or Microsoft Authenticator. Users can enrol one device at a time.
Complete the On-premises Active Directory steps to connect your Active Directory domain to Citrix Cloud
Under the Authentication tab of Identity and Access Management, click the ellipsis button and select Connect. Citrix Cloud should display a Connected message
Browse to Workspace Configuration and under the Authentication tab select Active Directory + Token.
At this stage your users will now have to enrol their device for tokens using an app such as Citrix SSO or Microsoft Authenticator.
Register devices for two-factor authentication
Browse to the Workspace sign-in page and select Don’t have a token?
Enter your Active Directory username
Citrix Cloud will send you an email that contains a verification code, enter that code along with your Active Directory password and click Next
If successful, a QR code will display. Scan this code using an app such as Citrix SSO or Microsoft Authenticator. You can also type the code manually. Click Finish and Sign In once complete
Re-enrol devices
If an end-user obtains a new phone, or their original phone is broken, lost, stolen etc, there are a couple of options to re-enrol with a new device, or simply invalidate an existing device.
Administrators can use the Recovery option from the Citrix Cloud portal to reset a user’s device. The administrator searches for the user, clicks Reset Device and then the user runs through the enrolment process again. This option will likely be used as a security measure if a phone is stolen or lost
An end-user can enrol a new device by simply following the same steps they took originally. Enrolling a new device or re-enrolling an existing device removes the previous device registration
Azure AD
Requirements
A Cloud Connector must be installed and joined to the domain that is synchronising to Azure AD
VDA 7.15.2000 LTSR or 7.18 Current Release or higher is required
The UPN and SID entries of user accounts must be synchronised from your on-premises domain to Azure AD
Nested groups are not supported for federated authentication using Azure AD
To enable Azure Active Directory authentication, you must use an Azure AD user who has Azure Global administrator permissions
Upon enabling Azure AD authentication
Users and groups should be managed using Libraries in Citrix Cloud. Do not assign users or user groups to Delivery Groups in the cloud-hosted Studio
Users sign into Workspace using an Azure-based sign-in page
To achieve SSO to applications and desktops, FAS must be used, but this technology is currently in Tech Preview as previously discussed. Without FAS, end-users are prompted twice for their credentials. Once when authenticating to Workspace, and a second time during session launch
Azure AD authentication flow
User browses to Citrix Workspace
Citrix Workspace redirects user browser to Azure sign-in page
User enters Azure AD credentials
User browser is redirected back to Citrix Workspace
User launches apps or desktops from Workspace
Citrix Gateway
Using your Citrix Gateway on-premises as an identity provider gives you the ability to use many different authentication types such as RADIUS, MFA, certificate authentication etc.
Requirements
Active Directory integration with Citrix Cloud
Users must be Active Directory users to authenticate with Workspace, as Citrix Cloud requires AD attributes to allow users to sign-in successfully
An on-premises Gateway running 12.1 build 54.13, or 13.0 build 41.20 Advanced edition or later
An OAuth IDP authentication policy is configured on Gateway using the generated client ID, secret and redirect URL obtained from enabling Citrix Gateway as an identity provider in Citrix Cloud
Gateway authentication flow
User browses to Citrix Workspace
Citrix Workspace redirects user browser to Gateway sign-in page
User completes authentication with Gateway using any authentication method configured on Gateway
User browser is redirected back to Citrix Workspace
User launches apps or desktops from Workspace
Citrix Federated Authentication Service (FAS) (Tech Preview)
As previously mentioned, Citrix FAS is also supported by Citrix Cloud to provide single sign-on to Workspace using Azure Active Directory authentication. Using FAS with Citrix Cloud is currently in Tech Preview, and currently only recommended to be used under testing purposes.
Requirements
FAS server deployed to your resource location
SSO is only available to users in resource locations where FAS servers are present
Subscriber sign-out experience
If a user closes their browser instead of using the Log Off option in Workspace, they might remain signed into Azure AD.
Secondly, if Workspace times out in the browser due to inactivity, users will remain signed into Azure AD, which is by design to prevent a Workspace timeout forcing other Azure AD applications to close.
Administrators and Subsribers
Administrators perform the management of Citrix Cloud services, and subscribers are your users who consume those services.
Administrators
Administrators can use their MyCitrix account to sign into Citrix Cloud, or an email address and password after being invited to join Citrix Cloud by another administrator.
Authenticating to Citrix Cloud as an administrator uses the Citrix Online sign-on system.
To add a new administrator to Citrix Cloud, an existing administrator would browse to Identity and Access Management -> Administrators.
You can remove administrators in the same way. Once an administrator is removed from your Citrix Cloud account and if they are already signed in, access is revoked after one minute.
Subscribers
Subscribers are linked to Active Directory domain accounts, forming an identity which can be assigned to a Library offering, which authorises the subscriber/identity to that offering. An example of this is when you create a Delivery Group from Studio hosted in Citrix Cloud. Instead of adding users or groups to the Delivery Group, you can add subscriber’s identities to the Library object that will be created in conjunction, which grants the users access to the relevant applications or desktops.
Domains that can be used to provide identities are managed under Identity and Access Management -> Domains.
Cloud Connectors can enumerate all domains from the single forest in which they are installed.
Disabling a domain from Citrix Cloud does not prevent subscribers from using identities that have already been allocated access to Library objects. New identities are prevented from being selected.
Citrix Cloud Connector
Cloud Connectors, which are installed in each of your resource locations, are the secure channel between your resource location and Citrix Cloud. The use of a Cloud Connector reduces the complexity of enabling cloud management against your infrastructure. Traffic from each of your resource locations to Citrix Cloud is outbound only, over TLS 443. This results in simplified network and firewall configuration.
The Cloud Connector enables Active Directory management, allowing the use of AD forests and domains within your resource locations. They also enable provisioning of machines directly into your resource locations, and enable publishing of resources from those machines etc.
In other words, Cloud Connectors speak to your Active Directory domain controllers and to your hypervisors during a publishing event like the creation of new machines in your resource location using Machine Creation Services.
OS, .NET and Server requirements
Server 2012 R2, 2016 or 2019 (no Server Core support).
All machines must be able to contact the following addresses to validate the above certificates:
http://*.digicert.com
https://*.digicert.com
HTTP port 80 is required to *.digicert.com as it is used during Cloud Connector installation and during periodic CRL checks.
Active Directory requirements
Each AD forest you plan to use with Citrix Cloud should be reachable by two Cloud Connectors at all times.
The Cloud Connector should be joined to the domain that contains the users and resources you will use.
The Cloud Connector must be able to reach the parent (root) domain controllers as well as child domain controllers in the AD infrastructure in which the Cloud Connector is installed.
Your forest and domain functional levels should be Windows Server 2008 R2 or later.
Network requirements
For external traffic to Citrix Cloud, Cloud Connectors only require TLS 443 outboud.
Traffic between Cloud Connectors and VDAs is encrypted using Kerberos message-level security.
For internal traffic:
Cloud Connectors require port 80 inbound and outbound to the VDAs, plus 1494 and 2598 inbound if using the Citrix Gateway service.
Cloud Connectors require access to your AD domain controllers, and Hypervisors. Required Hypervisor ports can be found in the Hypervisor documentation.
Citrix Gateway, if the Cloud Connectors are configured as a STA. This is port 80 inbound. SSL is not yet supported.
Connectivity requirements
Cloud Connectors require access to a number of services out on the internet, such as https://*.cloud.com. Firewalls and any outbound proxy servers should allow/whitelist access to these services so that Citrix Cloud can properly communicate with your resource location.
You should allow/whitelist FQDNs rather than IP addresses to avoid any outage if an IP address behind one of the FQDNs change. Additionally, whitelisting using wildcards prevents future connectivity issues to Citrix Cloud if Citrix introduce a new FQDN to improve the Citrix Cloud platform.
Citrix specifically call out:
Some critical functions of the platform, such as traffic failover based on geographical region, rely on being able to route calls under multiple subdomains. Whitelisting at the subdomain level increases the risk outage as these functions might use subdomains the customer hasn’t whitelisted. Whitelisting the wildcard domain allows these functions to work without placig an undue burden on the customer to whitelist a large number of subdomains for every Citrix Cloud service.
There are different FQDN exclusion requirements depending on which Cloud services you use. For the full list, see System and Connectivity Requirements.
Outbound proxy considerations
SSL decryption on certain proxies might prevent the Cloud Connector from connecting to Citrix Cloud. See CTX221535 for information on resolving this issue.
The Connector may attempt to access internal resources through the web proxy. Resources may also not be able to connect to the Connector and Virtual Apps and Desktops service. To reduce this risk, add the FQDN or IP address of each resource to the proxy bypass list on the Cloud Connector machine. More information can be found in CTX241222.
Size and scale considerations
Not sizing your Cloud Connectors appropriately can impact system performance. See the below two links to help with sizing:
In each of your resource locations, install multiple Cloud Connectors. Citrix recommend two per resource location.
Connectors are stateless, so one failing does not cause impact. As long is one is available, a connection to Citrix Cloud will be maintained.
Load is distributed across all available Connectors under normal conditions, but if one fails, the others will maintain the connection.
Install location
Install Cloud Connectors on dedicated Windows virtual machines that do not contain any other roles or components. With the exception of Server Core, which is not supported, Server 2012 R2 and above is supported to run the Cloud Connector software.
Deployment scenarios across multiple domains and forests
Single parent domain, optional child domains
For organisations with parent and child domains, create one resource location and install a pair of Connectors in your parent domain. Citrix Cloud will pick up the parent and child domains and list them under Identity and Access Management -> Domains.
You might need to restart your Connectors before they can detect child domains.
Separate resource and user forests with full trust
Install a pair of Connectors in your resource forest, and another pair in your user forest. If you only installed Connectors in the resource forest, you would have the following issues:
Workspace cannot authenticate users from the user forest.
Resources can only be displayed for users and groups residing in the resource forest.
When you install Connectors in both forests, the domains from each forest will appear under Identity and Access Management -> Domains.
Installation considerations
Citrix maintains the Citrix Cloud connector upgrades, so you should not manually try to upgrade a Connector.
Do not move the Cloud Connector to a different domain. If the machine needs to join a different domain, uninstall the Cloud Connector software, and re-install after the machine is joined to the different domain.
Installation logs
Installation logs can be found: %LOCALAPPDATA%\Temp\CitrixLogs\CloudServicesSetup.
After installation, logs are added to C:\ProgramData\Citrix\WorkspaceCloud\InstallLogs.
Cloned machine considerations
Installing the Cloud Connector on a machine template (before cloning) is not supported as all Cloud Connector machines need to have a unique SID and connector ID for Citrix Cloud to be able to communicate with them properly.
Cloud Connector health
The health of Cloud Connectors in relation to connectivity to Citrix Cloud can be viewed by navigating to Resource Locations in Citrix Cloud.
Event messages are written to the Windows Event Viewer.
Logs are written to C:\ProgramData\Citrix\WorkspaceCloud\Logs.
Check Windows Event Viewer or the logs from C:\ProgramData\Citrix\WorkspaceCloud\Logs.
If the Cloud Connector is “disconnected” and the logs do not indicate why, contact Citrix Support.
If the Cloud Connector is in an “error” state, install the Connector on a new machine, or failing that, contact Citrix Support.
CTX221535 covers common issues when installing or using Cloud Connector.
Resource Locations
Now that we have covered the control plane, the remaining pieces of a typical Virtual Apps and Desktops deployment are of course the applications, desktops and relevant data. These sit within your control, in resource locations. A resource location is simply a term used in Citrix Cloud to describe the location these pieces can be found. The resource location will also contain access to the domain, the hypervisors that host your VDAs, and optionally StoreFront and/or Citrix Gateway.
If you have resources in your own cloud or datacentre, those resources can remain where they are. You do not need to move them anywhere to use them with Citrix Cloud. Alternatively, your resources could be located in a public cloud.
There are no limits to how many resource locations you can have.
Zones
A resource location is considered a zone in a Virtual Apps and Desktops service environment. There are similarities with the Cloud version and on-premises Virtual Apps and Desktops zones. When you create a resource location and add a Cloud Connector to it, a zone is automatically created for you.
A zone can have the following:
Host connections
Machine Catalogs
Applications
Users
Citrix Gateway
StoreFront
A requirement for LHC
You can set preferred zones for applications and users, allowing you to control for example where resources are launched in accordance to application data location, or where users launch resources from in accordance to user data location.
You can edit a zone’s description, but not the name. If you want to delete a zone, you have to delete the resource location.
Maximum resource location name length is 64 characters.
A resource location must not match any other resource location name.
You cannot use the following characters in a resource location name:
#, $, %, ^, &, ?, +
Braces: [], {}
Pipes: |
LT or GT symbols: <>
Primary resource location
The primary resource location is one you select as the most preferred. Cloud Connectors in a primary resource location are used for user logons and provisioning operations, so the resource location you pick should have Cloud Connectors that have the best performance and connectivity to your domain, which will allow your users to log on quickly to Citrix Cloud.
Two considerations when choosing a primary resource location:
Does the resource location have the best connectivity to your domain?
Is the resource location closest to your Citrix Cloud console? An example of this is your console which resides at https://eu.cloud.com.
If Cloud Connectors in the primary resource location are unavailable, logon and provisioning operations are switched to another Cloud Connector in the domain.
To delete, reset, or change the primary resource location, browse to Identity and Access Management -> Domains, expand the domain that contains the primary resource location you want to change.
Create a resource location
From the Citrix Cloud portal, navigate to Resource Locations.
Click + Resource Location. Specify a name, click Save.
At this stage you are ready to add Cloud Connectors to your newly created resource location.
Install Cloud Connector
Before installing your Cloud Connector, make sure you have met all the prerequisites listed under OS, .NET and Server requirements, Certificate requirement, Active Directory requirements and so on.
Browse to the Citrix Cloud management portal from the machine that will host your Cloud Connector. Navigate to the Resource Locations section of Citrix Cloud, expand your resource location and click + Cloud Connectors.
Click Download.
Run the cwcconnector.exe software as an administrator to begin the installation.
Click Sign In and sign in with a Citrix Cloud administrator account.
The Cloud Connector installer will discover the customers and resource locations present under your tenant. Once you have selected the resource location where this Cloud Connector will be located, click Install.
Click Close on the connectivity test, which checks connectivity to Citrix Cloud before finishing the install.
Returning to your resource location in Citrix Cloud, you will now see your Connector present, and it should be healthy. Notice the warning about the lack of cloud connectors available. Citrix recommend a minimum of two Connectors per resource location, so perform the same install steps on a second virtual machine in your resource location.
Manage Cloud Connector update schedules
To keep your Cloud Connectors performing optimally, secure, and reliably, Citrix manage the updates of your Cloud Connector software versions and do so in a way that there will always be one Cloud Connector available to maintain service for your organisation.
Customers can pick update schedule times, so that Cloud Connectors are only updated by Citrix during non-peak hours for example. Update schedules are defined per resource location, so apply to all Cloud Connectors within that resource location regardless of what time zone those machines are in.
From the Citrix Cloud console, navigate to Resource Locations, locate your resource location, click the ellipsis and select Manage Resource Location.
Select Set a maintenance start time and choose the settings most appropriate for your resource location. Once done, click Confirm.
Unscheduled updates
There may be times where Citrix push out an update that does not conform to the schedules you have set. Scenarios such as:
The update could not be installed at your preferred schedule time within 48 hours of the update being available. For example, maybe your Cloud Connector was offline. In this scenario, the update pushes out immediately when the Connector comes back online.
The update contains a fix for a critical security or feature issue.
Use an account that has VM Power Admin or higher permissions when creating a hosting connection.
Use HTTPS to secure communications with Citrix Hypervisor by replacing the default SSL certificate. See CTX128656.
Microsoft Hyper-V:
The SCVMM console must be installed on all Cloud Connectors.
VMware vSphere:
Add the vCenter certificate to each Cloud Connector.
Provide the hosting connection with credentials to a service account that has vCenter permissions listed here.
Amazon AWS:
Provide the API key and secret key for your AWS account.
Provide the region where your private cloud is located, the availability zone, VPC name, subnet addresses, your domain name, security group names, and credentials.
Microsoft Azure:
Each resource group can hold 240 VMs.
Create Hosting connection
To begin your Virtual Apps and Desktops service journey, from the Citrix Cloud console, under the Virtual Apps and Desktops tile, click Manage.
The Manage tab opens and you are taken to a cloud hosted Studio, which looks just like Studio when you first configure your Site. Click on Connect to the resources that will host the machines.
Create a Hosting connection to your private cloud or public cloud hosting location. In this example, I am connecting to Citrix Hypervisor which sits in my on-premises resource location. Click Next, define your storage and networking components and so on.
Create machine catalog (using MCS)
To create your first machine catalog which will deploy virtual machines to your resource location. In this example MCS will be used to deploy the machines. Click Set up the machines and create machine catalogs to run apps and desktops.
Select one of the following options based on the machines you are deploying and click Next.
Select your deployment method. In my example, we will use MCS. Click Next.
Specify your master image, set the minimum functional level for the catalog and click Next.
Choose how many machines you want to create, the RAM of each machine, and optionally MCS IO cache settings. Click Next.
Give a location and naming scheme for your machines in your Active Directory. Click Next.
At this stage you are asked for domain credentials that will be used to create the machine accounts in Active Directory. This is one of the differences between an MCS deployment using Virtual Apps and Desktops service compared to the on-premises product.
The Cloud Connector which MCS uses to create the machine accounts in Active Directory only has read access to AD, this is why you are asked explicitly for credentials. Those credentials are stored in memory for this single operation.
Click Enter credentials, specify credentials and click Next.
Specify a name for your catalog and click Finish.
After some time, the virtual machine should appear in Studio and registered providing you pointed the machine at your Cloud Connectors for registration, which is explained below.
Configure VDAs
You install VDAs in the normal way but point them at the Cloud Connectors in your resource location.
Create a Delivery Group in the normal way. One of the differences is when you are given the option to specify what users or groups can use resources from the Delivery Group.
You have the option Leave user management to Citrix Cloud.
This makes the Delivery Group available as a Library offering in Citrix Cloud under Libraries. You can then specify users or groups against that offering.
Citrix Provisioning
I demonstrated creating a Machine Catalog using Machine Creation Services, but you can also provision VDAs to your resource location using Citrix Provisioning, and then add those machines to your Machine Catalogs in Citrix Cloud.
Licensing
If you plan to use Citrix Provisioning with your deployment, an on-premises License Server is required.
The PVS\_CCLD\_CCS license type supports the Virtual Apps and Desktops service. This license type replaces the on-premises Citrix Provisioning licenses for desktops and provisioning for datacentres.
You use the Provisioning Services Configuration Wizard, or the Licensing tab to select the Cloud radio button for licensing. Changes to licensing options requires the stream service to be restarted.
Connecting Citrix Provisioning to Citrix Cloud
Citrix recommends using Provisioning 7.18 or later with Citrix Cloud.
Uninstall the Virtual Apps and Desktops SDK on your Citrix Provisioning console machine by removing the following snap-ins:
Citrix Broker PowerShell snap-in
Citrix Configuration Logging Service PowerShell snap-in
Citrix Configuration Service PowerShell snap-in
Citrix Delegated Administration Service PowerShell snap-in
Citrix Host Service PowerShell snap-in
Now install the Citrix Virtual Apps and Desktops Remote PowerShell SDK which can be downloaded here. To install, issue command CitrixPoshSdk.exe PVS=YES and follow the prompts.
To verify the SDK installation, run cmdlet Add-PsSnapin Citrix.* followed by Get-BrokerServiceStatus and authenticate to Citrix Cloud. You should be returned with an OK ServiceStatus message.
When asked for a Controller address, enter one of your Cloud Connector machines that exist in the same resource location. You will then be required to authenticate to Citrix Cloud.
Troubleshooting Citrix Provisioning with Citrix Cloud
Make sure the old PowerShell snap-ins are removed.
Make sure the Remote PowerShell SDK is installed on your Provisioning Console machines and confirm it is installed using the cmdlets mentioned above.
Make sure the Cloud Connector can communicate with your Citrix Provisioning systems.
Make sure the Provisioning account is a member of the local administrators group on your Provisioning servers.
Make sure that Citrix Provisioning support in Citrix Cloud is enabled. Make sure that the PvsSupport feature is enabled against your Citrix Cloud account.
Make sure the Citrix Remote Broker Provider service is running on your Cloud Connectors.
Connecting to resources from on-premises, customer-managed StoreFront
If you plan to use an on-premises StoreFront deployment, to enumerate resources from Citrix Cloud, add the Cloud Connectors in as Delivery Controllers to your StoreFront store.
To test, browse to your StoreFront URL, or use Workspace app, and you should be able to see resources enumerated from Citrix Cloud.
In this example, CC-Notepad is a published application created earlier from the Citrix Cloud hosted Studio.
Connecting to that resource locally makes a direct connection to the VDA. The session information from Citrix Cloud hosted Studio shows that.
Local Host Cache
As previously mentioned, one of the main benefits of deploying your own StoreFront servers to your resource location(s) is that you can use Local Host Cache if a connection from your resource location Cloud Connectors to the Citrix Cloud control plane is lost.
Local Host Cache is enabled by default for all Citrix Virtual Apps and Desktops service customers.
If you use Citrix Workspace, Local Host Cache does not work. This would equal an outage for any new session trying to establish during the outage.
Local Host Cache contains a subset of the information in the main Citrix Site database:
The identities of users and groups who are specifically assigned resources published from the Site.
The identities of users who are currently using or have recently used published resources from the Site.
The identities of VDA machines configured in the Site.
The identities (names and IP addresses) of Workspace app machines being actively used to connect to published resources.
The Citrix Remote Broker Provider Service on a Cloud Connector accepts connection requests from StoreFront and communicates with Citrix Cloud to connect users to VDAs that are registered with the Cloud Connectors.
The Citrix Config Synchronizer Service (CSS) check with the primary broker in Citrix Cloud approximately every two minutes to see if any configuration changes have been made in the Site database.
If yes, CSS copies the changes to the Citrix High Availability Service, which writes them to the SQL Server Express LocalDB database on the Cloud Connector.
Note that the LocalDB database is re-created each time synchronisation occurs. If there are no changes, configuration data is not copied.
Outage operations
The Citrix High Availability Service (secondary broker) starts listening for and processing connection requests.
When VDAs next communicate with the secondary broker, they re-register with that secondary broker and pass their current session information along.
The Brokering Principal continues to monitor the connection to Citrix Cloud and when connectivity is restored, this service informs the secondary broker to stop listening for connection information. The Brokering Principal takes over the role of listening for and processing connection requests. VDAs will re-register with the principal broker when they next communicate with it.
The CSS service resumes the task of synchronising any configuration changes made in Citrix Cloud, copying them to the High Availability Service.
Force outage
Forcing an outage can be used as a way to test your disaster recovery plan, or when there are intermittent network issues causing a connection between your resource location and Citrix Cloud to continuously drop.
Set OutageModeForced DWORD to 0x1 under HKLM\SOFTWARE\Citrix\DesktopServer\LHC
The Current_HighAvailabilityService log under C:\ProgramData\Citrix\WorkspaceCloud\Logs\Plugins\HighAvailabilityService can be used to track events.
Other LHC considerations
The CSS service frequently provides the secondary broker with information about all Cloud Connectors in the resource location, allowing all secondary brokers to know about their peers.
An alphabetical list of FQDN Controller names is used to determine which secondary broker will take over the duty of listening for and processing connection requests if LHC mode is activated. Any secondary broker that is not elected will reject incoming connection and VDA registration requests.
VDA re-registrations
There are various events that cause all VDAs in a resource location to re-register with an elected secondary broker. A secondary broker is elected based on an alphabetical list of FQDN Controller names.
If a connection to Citrix Cloud is lost, the secondary broker of the elected Controller in your resource location will listen for and process all requests. VDAs when they next communicate with this secondary broker will re-register with it.
If that elected secondary broker also fails, or reboots during an outage, another secondary broker will take over according to the alphabetical list of FQDN Controller names. This will cause VDAs to re-register again.
If the previously elected secondary broker comes back online, another VDA re-registration event will occur.
When an outage ends, VDAs will re-register with any of the healthy Controller’s Brokering Principal in your resource location a further time.
Each re-registration process causing temporary disruption to available resources, as VDAs cannot be used to take on sessions if they are in the middle of re-registering.
Whilst VDAs register with a broker, that broker may not have the complete set of information on current sessions, so a user connection request during this time may end up being a brand-new session, even if an existing session was available. This is unavoidable.
What is not possible during an outage
Monitoring data from your VDAs is not sent to Citrix Cloud.
Machines appear in an unknown power state, and no power operations can be executed.
Published application and shared desktop users may end up with more than one session, even with session limits configured.
Applications and desktops can only be launched from the Zone that contains an elected secondary broker.
If scheduled restarts are due to occur during the time of an outage, the restarts begin when the outage ends.
Pooled VDI desktops
LHC cannot be used with pooled VDI desktops that have the ShutdownDesktopsAfterUse property enabled, which they do by default. If you want those desktops to be used during an outage, then you must do two things:
Raise a support call to have Citrix override the default behaviour site wide. They will issue command: Set-BrokerSite -ReuseMachinesWithoutShutdownInOutageAllowed $true
For each pooled VDI Delivery Group you want to make available, run Set-BrokerDesktopGroup -Name “name” -ReuseMachinesWithoutShutdownInOutage $true
Note that overriding the default behaviour of ShutdownDesktopsAfterUse does not affect desktops shutting down after use during normal operations.
RAM size considerations
The LocalDB service can use up to 1.2GB of RAM.
The High Availability Service can use up to 1GB RAM if an outage lasts for an extended period of time and there are many session launches during that time.
These extra RAM considerations are in addition to the normal Cloud Connector RAM recommendations, so you will want to make sure that if you want to use LHC, you size the RAM on your Cloud Connectors appropriately.
CPU core and socket considerations
LocalDB is limited to a single CPU socket and supports up to 4 cores in a single socket, so do not add more sockets as a means to improve performance.
Because only one Controller is elected at a time during an outage, all VDAs from the same resource location will re-register with the secondary broker on that Controller. This, amongst all the other requests this Controller will now take on, will result in increased CPU usage above what is found under normal operations. This needs to be taken into consideration for all your Cloud Connectors that could end up being the elected broker.
Storage considerations
The more users you have launching sessions during an outage, and the longer that outage lasts, the more LocalDB grows. Citrix tested 10 logons per second and the database grew by 1MB every 2-3 minutes.
When an outage ends, the LocalDB is recreated and thus drops in size.
During an outage Local Host Cache adds around 3MB of writes per second to your elected Controller, with several hundred thousand reads.
Local Host Cache in operation
An outage begins by the Cloud Connectors failing to communicate with the primary Broker, in Citrix Cloud, for 20 seconds.
The Citrix Configuration Synchronizer Service (CSS) will also report an error connecting to the broker in Citrix Cloud to see if any configuration changes have been made that should be synchronised to LocalDB.
The Citrix High Availability Service on a Controller in your resource location will be elected to listen for and process requests.
VDAs in your resource location will detect that a connection to the Brokering Principal is no longer possible.
The VDAs will re-register, this time with the elected secondary broker residing on a Controller in your resource location. Again, election is performed using an alphabetical list of FQDN Controller names.
Connections launched from the customer-managed StoreFront are still possible.
Note that application enumeration under an outage is slightly faster as no traffic is going to Citrix Cloud.
Once the outage ends, the Citrix High Availability Service stops listening for and processing requests, and the primary broker takes over.
Configuration Logging
Configuration Logging allows you to get a historic trail of configuration changes or actions taken within your Virtual Apps and Desktops deployment, such as updating HDX policies, logging off sessions, power managing machines, creating new Delivery Groups.
Configuration changes or activities executed from Studio (Manage), Director (Monitor), or from PowerShell will be logged. You will not see Citrix Cloud internal platform operations like database setups or management in the logs.
Having this logging at hand can help troubleshoot what changed if a new problem arises, report on administrative activity, and track configurations for change management.
You cannot delete or edit any Configuration Logging content from Studio. The Remote PowerShell SDK can be used to schedule periodic data deletion from the log, using cmdlet Set-LogSite -LoggingDBPurgeDurationDays. The default value is 0, meaning data is never deleted. If you set a different value, the database is checked every 120 minutes with data older than the retention period being deleted.
Configuration Logging permissions
Full Administrators in Citrix Cloud, Virtual Apps and Desktops service Cloud Administrators, and Read Only Administrators can view configuration logs in Studio.
Full Administrators and Cloud Administrators can download a CSV report of the Configuration Logging information using PowerShell.
Differences from on-premises edition
Configuration Logging cannot be disabled.
The Configuration Logging database location cannot be changed, since it is managed by Citrix.
You can export the logs to CSV via PowerShell only. The on-premises product supports output to CSV or HTML from PowerShell or Studio.
You cannot delete log content.
Delegated administration
Full Citrix Cloud administrators, who are added from Identity and Access Management -> Administrators, are assigned the Cloud Administrator role in Virtual Apps and Desktops service by default, which gives them full permissions.
You can instead assign them to any of the below roles, which are built-in to the Virtual Apps and Desktops service:
Cloud Administrator – Can perform all tasks under the Manage and Monitor tabs of the Virtual Apps and Desktops service.
Delivery Group Administrator – Can delivery applications, desktops and machines from the Manage tab. Can also manage power settings etc.
Full Monitor Administrator – Can perform all tasks under the Monitor tab.
Help Desk Administrator – Can see machine catalog and host information, manage sessions and machines etc from the Monitor tab.
Host Administrator – Can manage host connections and their associated sessions from the Manage tab.
Machine Catalog Administrator – Can create machine catalogs, provision new machines, and manage base images from the Manage tab.
Probe Agent Administrator – Can access Probe Agent APIs.
Read Only Administrator – Can see all objects under the Manage tab.
Custom Roles and Scopes
Like the on-premises version of Virtual Apps and Desktops, you have the option of creating custom roles and scopes. When you create a custom role and scope, the combinations will appear for selection under the Identity and Access Management -> Administrators portion of Citrix Cloud.
If you select an administrator, select Edit Access and choose the Custom access radio box, you will see your role and scope for selection.
Differences from the on-premises edition
You do not assign administrators with permissions to Virtual Apps and Desktops using their AD account. Instead, you assign permissions (roles and scopes) to their Citrix Cloud login.
Administrators are created, edited and deleted from the Citrix Cloud console, not the cloud hosted Studio.
You cannot produce delegated administration reports.
The Cloud Administrator role is similar to the Full Administrator on-premises role, which is not present as a role in the Virtual Apps and Desktops service.
If you are familiar with Citrix Director, the Monitor tab in Citrix Cloud is your access to cloud hosted Director. I am not going to go into detail here as things are much the same across cloud and on-premises. If you want more information see here: https://docs.citrix.com/en-us/citrix-virtual-apps-desktops-service/monitor.html
Licensing
Virtual Apps and Desktops licensing can be found under Licensing in the Citrix Cloud portal.
Here you can get a view of how many licenses have been assigned, and to what users/devices, with the ability to release licenses. You can export this data to CSV.
Using Workspace with Active Directory + Token
We have already connected to resources using an on-premises StoreFront server. Now I will show using Workspace from Citrix Cloud, and also using Active Directory + Token for authentication to the Virtual Apps and Desktops service.
From the Citrix Cloud console, navigate to Workspace Configuration -> Service Integrations and make sure Virtual Apps and Desktops is set to Enabled.
Navigate to Identity and Access Management -> Authentication and set Active Directory + Token to Connected.
Navigate back to Workspace Configuration.
Under the Access tab, make sure that your Workspace URL is set to Enabled. If you want to change the URL, click Edit. This is the URL your end-users will use to access their resources either through a web browser, or from Workspace app.
Click on the Authentication tab and select the Active Directory + Token radio box. This enables that authentication method against Workspace.
Registering for token
For an end-user to authenticate to Workspace, they must register a device for token authentication. To do this, browse to the Workspace URL for your organisation and click on Don’t have a token?
Enter your AD username and click Next.
An email should be sent to your corporate address, with a verification code as below.
Return to your Workspace and enter the verification code, along with your AD password. Click Next.
Using any mobile app that supports the Time-Based One-Time Password standard, such as Citrix SSO or Microsoft Authenticator, scan the QR code, or enter the code manually into the app. Click Finish and Sign in once complete.
Now enter the relevant authentication details, click Sign In, and you will be authenticated to Workspace.
To verify, launch an application, and this time you will have taken the Citrix Cloud Workspace route to connect in.
Resetting a device
If an end-user obtains a new phone, or their original phone is broken, lost, stolen etc, the end-user can re-enrol a new phone themselves, or you can reset their existing device.
From Identity and Access Management -> Recovery, use the domain drop-down to select the user identities domain, search for the username and click Reset Device.
Citrix Gateway service
If you have internal access only configured against your Virtual Apps and Desktops resource location, external users that try and launch resources from Workspace will simply be denied access:
To allow users to access their VDAs from outside the corporate network, one of your options is to enable the Gateway service against your deployment. The Gateway service is an easy to deploy remote access solution, hosted in Citrix Cloud, that can be enabled in minutes and negates any need for you to deploy a Gateway within your own resource location, and configure the associated routing and firewall rules to make it work.
As of March 2020, there are more than 20 Gateway PoPs (points-of-presence) available globally across AWS and Azure. When you make a connection to resources through the Gateway service, you will be connected to one of these globally available PoPs by the Cloud Connectors, the one closest and best performing to your location.
PoPs make use of the Azure and AWS high-quality virtual WAN backbones which provide efficient routing, higher bandwidth, less latency and less congestion than your typical connection across the public internet.
When using the Gateway service, you must use Citrix Workspace. You cannot use StoreFront with the Gateway service.
Also, the HDX communication path changes:
For external connections, the ICA traffic path is from the VDA -> Cloud Connector -> Gateway service -> end-user device.
For internal connections, the ICA traffic path is from the VDA -> Cloud Connector -> Gateway service -> end-user device.
Note that the internal traffic path can be altered using the rendezvous protocol, covered later in the article.
To enable the Gateway service, navigate to Workspace Configuration -> Access and under External Connectivity, click the ellipsis beside your resource location and select Configure Connectivity.
Select the Gateway Service radio box and click Save.
The resource location will now show as using the Gateway service. That’s it, done.
Browse to the Workspace URL from an internet device and you will be able to launch your published resources, securely through Gateway service.
However, when users are connected to the corporate network and use Workspace to launch their applications and desktops, the connection still routes through the Cloud Connectors and the Gateway service. As you can see below, one of my sessions is connected via the Cloud Connector IP address.
Wireshark also confirms that the Cloud Connector is sending and receiving ICA traffic from a Gateway service PoP.
This brings us on to the rendezvous protocol.
Rendezvous protocol
There is a new protocol, rendezvous, which allows connections to bypass the Cloud Connectors, eliminating this extra unnecessary traffic hop and increasing the scalability of your Cloud Connectors. Cloud Connectors can support up to 1000 concurrent sessions, but if growing above that, the Cloud Connector would become a bottleneck and you would have to deploy more.
The rendezvous protocol allows the VDAs to connect directly to the Gateway service, specifically the Flow Redirector, which is a component on the Gateway service, bypassing the Cloud Connectors in your resource location for HDX traffic once the session is established.
If the VDA cannot make a direct connection to Gateway service, then it will fall back to the Cloud Connectors.
For VDAs to be able to directly connect to the Gateway service, there are a few conditions that must be met:
You have to use Workspace to access your resources, which also is true for being able to use the Gateway service.
Your VDAs must run the Virtual Apps and Desktops 7 1912 LTSR version.
The rendezvous protocol must be enabled via Citrix Policy (it is already enabled for all customers at a Citrix Cloud level).
VDAs must be able to access https://*.nssvc.net including subdomains.
A DNS Reverse Lookup Zone with PTR records for the VDAs must be configured.
A particular SSL Cipher Suite order must be configured, which is easily accomplished via Group Policy.
Enable Rendezvous Protocol policy
Set the Rendezvous Protocol policy to Allowed from Studio in Citrix Cloud.
Configure Cipher Suite order
Using a Group Policy Object targeted against your VDAs, navigate to Computer Configuration -> Administrative Templates -> Network -> SSL Configuration Settings -> SSL Cipher Suite Order.
Make sure the Cipher Suite order begins with the below:
There are many more Cipher Suites configured in Windows, so adjust those in the order as necessary. Click OK.
Note that there is no need to specify the ECC Curves in the Cipher Suite order. Windows defines those in a separate policy setting, the ECC Curve Order, which is already configured correctly by default.
Confirming Rendezvous
Now when you launch a resource from Workspace, it should connect via the Gateway service, rather than the Cloud Connector.
You can further confirm that rendezvous is working by viewing the session information from the VDA. The Local Address will be 0.0.0.0 with a random 5-digit port number at the end, and the Remote Address is showing the Gateway service IP the session is connected to.
Wireshark shows a PrepareRendezvousSession operation as part of a SOAP message.
The below capture shows my client IP (1.80) performing an SSL handshake with the Gateway service to secure the communication.
The Cipher Suite TLS_ECDHE_RSA_WITH_AES_128_CBC_SHA is agreed by both parties.
Rendezvous considerations
Proxy support for Rendezvous is on the roadmap, but for now you cannot use it with a proxy.
Autoscale
Autoscale is an exclusive Virtual Apps and Desktops service power management feature, which replaces the deprecated Smart Scale technology and integrates into the Studio power management solution. The focus of Autoscale is to address typical cloud use cases like burst, disaster recovery, high availability, seasonlity short-term scale, cost savings etc.
Autoscale support
Autoscale supports all the platforms that Virtual Apps and Desktops service supports such as Citrix Hypervisor, Hyper-V, VMware vSphere, AWS, Azure, GCP etc.
RDS and VDI workloads are supported for power management.
Migrating from Smart Scale
To migrate from Smart Scale to Autoscale, you export the data from the former and import to the latter. See CTX250034 for more information.
Autoscale power management capabilities
The capability of Autoscale can generally be described as three different categories:
Schedule-based scaling
If there are set working patterns in your organisation, e.g. 9am-5pm, you can define the number of machines, or a percentage of the Delivery Group that must be powered on. You can create multiple schedules for different days of the week to suit your needs.
Taken from the RDS Autoscale interface
Load-based scaling
If work patterns are not so predictable, Autoscale can dynamically power on and off machines in a Delivery Group as the load increases and decreases. Load-based scaling works together with schedule-based scaling so that users do not have to wait on machines to power on if there is a sudden spike in new sessions being initiated.
Taken from the RDS Autoscale interface
Miscellaneous settings
This section allows you to control how long a machine is kept powered on, between 0-60 minutes, until it is powered off, which helps to avoid machines going up and down during volatile session demands. You can also define the machine instance per hour, in $, which helps calculate the cost savings of all the Autoscale settings you configure against the Delivery Group. This information is viewable from Monitor -> Trends -> Machine Usage.
Taken from the RDS Autoscale interface
Autoscale user interfaces
There are slightly different user interfaces for the pooled VDI, static VDI, and RDS Delivery Groups. The settings are farily consistent though:
Pooled VDI
Static VDI
RDS
Enable Autoscale
By default, Autoscale is actually enabled for each of your Delivery Groups.
If you disable Autoscale, any machine in the Delivery Group that has been put into drain state by Autoscale will be taken out.
Schedules quick information
Schedules operate based on the time zone configured against a Delivery Group.
There are two default schedules:
Weekdays: This schedule keeps one machine powered on from 7am-6:30pm, and non during off-peak times. The default capacity buffer is set to 10% during both peak and off-peak times.
Weekend: This schedule keeps all machines powered off.
Only machines that are registered are considered by the schedules. It does not make sense to include non-registered machines in capacity calculations.
You can create multiple schedules against a single Delivery Group. A schedule can span one or multiple days. You use the Autoscale schedule drop-down to create new schedules, and also to select the schedules you want to define.
For pooled VDI, a schedule can span all or multiple hours of the day, and you have full flexibility of how many machines are powered on during each hour, or the percentage of the Delivery Group that is powered on during each hour.
For RDS Delivery Groups, you have full flexibility of how many machines are powered on during each half hour.
You cannot create two schedules against a Delivery Group that target the same day. If you do, the schedule you created most recently will clear out the previous schedule.
You cannot have duplicate schedule names.
Schedule names cannot contain the following characters:
\, /, ;, :, #, ., *, ?, =, “, ‘, `
Braces: [], (), {}
Pipes: |
LT or GT symbols: <>
Disconnected VDI machines across time periods
If you have VDI machines with disconnected sessions in a peak or off-peak time period that has the When disconnected action set to No action, and those machines transition to a peak or off-peak time period that does have an action set, such as Shutdown, those actions are executed 10 minutes after the machine transitions to the new time period.
This was not the case in earlier releases. If you do not want this new behaviour to apply to your VDI machines:
Set the LegacyPeakTransitionDisconnectedBehaviour DWORD under HKLM\SOFTWARE\Citirx\DesktopServer to 0x1
or
Run PoSH command Set-BrokerServiceConfigurationData HostingManagement.LegacyPeakTransitionDisconnectedBehaviour -SettingValue $true
Before a machine can have a power action applied to it after a period transition, it must meet the following criteria:
Have a disconnected session.
Have no pending power actions.
Belong to a VDI Delivery Group that transitions to a different time period.
Has a disconnected session during a peak time for example that transitions to an off-peak period where a power action is set.
Capacity buffer
A capacity buffer can be set against a static VDI, pooled VDI or RDS Delivery Group, allowing a percentage of desktops to be powered on above the normal schedule, which helps prevent end-users waiting on desktops powering on in the event of a surge in new session launches.
Note for static VDI, unassigned desktops are powered on based on the total number of unassigned machines in a Delivery Group. The default capacity buffer is 10%. After all machines are assigned, the capacity buffer does not process any future power actions against the static VDI desktops.
Capacity buffers are set against peak and off-peak times.
For RDS Delivery Groups, the capacity buffer is defined as a percentage of the total capacity of the Delivery Group in regards to load index. For VDI Delivery Groups, the capacity buffer is defined as a percentage of the total number of machines in the Delivery Group.
When defining capacity buffers for your peak and off-peak times, consider the cost your organisation may incur versus user experience when it comes to waiting for a desktop to power on before a session can be established, more so when there is a sudden spike in the number of sessions being launched by your end-users.
Tags
You can use tags with Autoscale, so that only specific machines in a Delivery Group are power managed. Apply a tag to one or more machines, and then use the PowerShell SDK to set the tag against a Delivery Group you want Autoscale to power manage, using the Set-BrokerDesktopGroup -RestrictAutoscaleTagUid cmdlet.
Drain
When user sessions drop and the schedule does not require as many machines to be powered on, Autoscale always attempts to scale down the number of powered-on machines in a Delivery Group to match the configured schedule and capacity buffer. Any excess machine with the lowest number of sessions is placed into a drain state, and powered off when all sessions have cleared.
If there is a sudden surge in new connections, Autoscale will not power on new machines, but direct sessions to machines in a drain state if applicable.
Estimated savings
To get a view of how much savings your organisation makes when using Autoscale to power off machines when they are not needed, you can refer to the Monitor -> Trends -> Machine Usage section of the Virtual Apps and Desktops service. A pie chart will show you the estimated savings for each of your Delivery Groups that Autoscale is power managing.
Network Location service (Technical Preview)
NLS, which is currently in Technical Preview, is designed to overcome the undesired traffic flow found with internal connections using a Workspace deployment that has the Citrix Gateway service enabled. You see, when internal users with direct connections to their VDAs launch a resource from Workspace, and the Gateway service is enabled as previously discussed, the ICA traffic flows out of the client network, to the Gateway service, and back into the client’s network, rather than directly to their VDA. This understandably introduces some unwanted latency, and also introduces unnecessary traffic hops through Cloud Connectors if the Rendezvous protocol is not enabled or configured correctly.
The Network Location Service will allow end-users initiating internal connections to connect directly to their VDA resources, bypassing the Gateway service completely. This is achieved by configuring network locations, the public IP ranges of the networks your internal users will be connecting from, using the Network Location service PowerShell Module.
With this configured, and with users launching resources
from one of the public IPs configured using the PowerShell module, Citrix Cloud
will be able to determine that the user is coming from an internal network and
routes the ICA connection direct to the VDA.
Network requirements
If you have corporate and guest networks e.g. guest Wi-Fi, the networks must have separate public IP addresses otherwise only the corporate network connected users can launch Virtual Apps and Desktops sessions.
Public IPs you configure for NLS must be of networks that have direct connections to the VDAs users will be attempting to connect to.
TLS requirements
TLS 1.2 must be enabled in PowerShell to connect to the Network Location service. To force PoSH to use TLS 1.2, run command [Net.ServicePointManager]::SecurityProtocol =[Net.SecurityProtocolType]::Tls12
Workspace requirements
You must be using on-premises VDAs to deliver virtual resources to your end-user workspace subscribers, with Virtual Apps and Desktops set to Enabled under Workspace Configuration -> Service Integrations.
Workspace app for HTML5
If you have users connecting to resources using Workspace app for HTML5, you must secure the ICA traffic. See https://www.jgspiers.com/secure-ica-connection-vda-ssl/ for details on how to encrypt ICA traffic between client and VDA.
Required information for NLS
Besides your public IP addresses where internal users will
connect from, you must also obtain your Citrix Cloud customer ID, client ID,
and client secret.
To obtain your customer ID, create a client ID and client
secret, from Citrix Cloud, browse to Identity and Access Management
-> API Access.
Note the customer ID, in my case JGSPIERS. Enter a name for
the client and click Create Client.
Copy your client ID and client secret, storing them in a
safe place. These values cannot be viewed again from the Cloud console. Alternatively,
you can click the Download button to download the values to a CSV file.
Click Close.
Create network locations
Firstly download the Network Location service PowerShell module, nls.psm1 from the Citrix Github repository.
Open PowerShell and browse to the location where you previously downloaded the Network Location service PowerShell module, nls.psm1. Run cmdlet Import-Module .\nls.psm1 -force
Next create three variables for your customer ID, client ID and client secret.
Be sure to force PowerShell to use TLS 1.2 using command [Net.ServicePointManager]::SecurityProtocol =[Net.SecurityProtocolType]::Tls12
Connect to the Network Location service using the three variables created previously.
Now create a new NLS Site for each of your public networks. The command will be New-NLSSite -name “yourname” -tags@(“yourtags“) -ipv4Ranges @(“yourpublicIPv4range“) -longitude yourlongitude -latitude yourlatitude.
Verifying NLS
Now when an internal user launches a session from this public network, Citrix Cloud will detect the connection is coming from an internal network and route it direct to the VDA. You can see this from Studio.
You can also see from the session details that the local address (VDA) and client address are on the same subnet, and EDT is being used to transport the ICA traffic.
Enlightened Data Transport Protocol (Adaptive Transport)
For those ICA packets to traverse the network using UDP, sessions brokered from the Virtual Apps and Desktops service must be internal/direct to the VDA or via an on-premises Citrix Gateway.
Citrix Gateway service currently does not yet support EDT. Citrix plan for a Tech Preview later this year. Also note that Rendezvous will be required for EDT through the Gateway service.
Performance Analytics is part of the Citrix Analytics service offering from Citrix Cloud. This article explains the newest addition to the Analytics platform, Performance Analytics, which just left Technical Preview after Citrix Summit 2020.
User experience (UX) is the most critical success indicator of any system deployment. Any system you offer as a service to your end-users must, at a high level, be highly available, readily available, responsive, and pose no issues.
To describe this in the context of a Citrix deployment, an application I publish to my end-users via Virtual Apps and Desktops must be easily accessible, it must launch quickly, it must perform like a local application install would in terms of how quickly it reacts to user interaction. Finally, it should not crash out, perform slowly at random times, or throw out any system errors that stop end-users from doing their job.
So how does a published application avoid being on the wrong end of any of these scenarios that would result in poor end user experience? Well, there are several different pieces of infrastructure that are accountable:
Fast datacentre network: low latency, sufficient bandwidth capacity.
Fast storage: low latency, sufficient I/O capacity.
Virtualised hosts: sized for peak usage, do not reach capacity limits that could impact user experience.
These hosts could be running on-premises such as Citrix Hyperspace, Hyper-V, VMware, or in a public cloud such as Azure or AWS.
Desktops or Session Host servers: sized for peak load, do not suffer from stress during busy periods of the day.
Fast client network into the datacentre: low latency, sufficient bandwidth capacity whether the connection is internal or external.
This is certainly not the entire list. We could be more specific or talk about the application build etc however I’ve listed some of the important examples.
Due to the various and complex components that contribute to performing Citrix session, organisations seek monitoring solutions that help them avoid reaching such issues like slow network access, high hypervisor hardware utilisation and so on.
This is why amidst the focus on user experience, it is important that monitoring solutions continue to track and alert on any of the components needed to deliver a great user experience.
User experience monitoring
Whilst monitoring products have traditionally kept track of the performance and health of components within your datacentre, software companies that provide purpose-built Citrix monitoring solutions have more recently been developing their products with end user experience top of mind. Rather than just alerting when a server is not responding, or if storage latency is high, etc, solutions are being extended beyond the traditional monitoring, now focusing more on what the actual user experience is based on logon times, latency, desktop response times and so on. All of these measurements form the overall user experience score.
Being able to report on user experience based on received data is very powerful for the customer running a Virtual Apps and Desktops deployment.
Citrix Performance Analytics
Citrix have developed and released their own user experience (UX) reporting analytics platform, Performance Analytics, or Citrix Analytics for Performance, which is hosted in Citrix Cloud.
This solution calculates the user experience for every user accessing applications and/or desktops from your Virtual Apps and Desktops service, or on-premises Virtual Apps and Desktops deployments using a machine learning engine, which quantifies a number of key performance indicators to determine the UX score.
You can aggregate performance metrics from multiple Cloud and on-premises environments into the single Performance Analytics dashboard and drill down into specific user sessions that are facing performance issues to narrow down the factors that are causing it.
Additionally, the solution also tracks the health of VDAs used across your environments and reports the times when VDAs are unavailable due to being unregistered etc or when they are at high load. Having such analytics at hand further helps you avoid performance issues or bottlenecks due to sub-optimal performance or a reduced number of VDAs.
Accessing Performance Analytics
From the Citrix Cloud console, click on My Services -> Analytics.
Under Performance, click Manage.
Click Get Started if this is the first time using this service.
Who can use it?
Performance Analytics is available as a subscription, stand-alone offering, or bundled with Analytics for Security.
Customers who run Virtual Apps and Desktops on-premises, in Citrix Cloud, or a mixture can sign up for Performance Analytics.
For on-premises customers that also have a Gateway on-premises, they must onboard the Gateway to get access to network related information in Performance Analytics. They must also onboard their Virtual Apps and Desktops Site.
Performance Analytics gets its data from the Monitoring database you are familiar with when setting up Director. That data is either stored in your on-premises Monitoring database or or Citrix Cloud, for those Virtual Apps and Desktops service deployments.
For on-premises data, HTTPS/443 is used to push the data from Director to Citrix Cloud. There is no data going from Citrix Cloud to your on-premises environment.
Asides Monitoring data extraction from Director, Performance Analytics also consumes information from Citrix Gateway.
Dashboards
The Performance Analytics solution is split into two sections that are viewed as separate dashboards, Users and Infrastructure.
What you will notice throughout both dashboards is that data is collected from all of the Sites you have connected to Performance Analytics. If you wish, you can filter at the top of each dashboard, so that data is displayed only from a specific Site.
Users dashboard
The Users dashboard gives you a clear, high-level view of the different types of experience being received by your end-users. The first thing you will notice is the User Experience (UX) scores. These scores are made up of indicators such as session responsiveness, logon duration time, session failures, session reconnects and so on. You can view the experience indicators over 2 hours, 1 day, 1 week, etc and you are able to drill into them for further information which can be helpful when troubleshooting.
The UX score is calculated from different metrics measures from a user’s initial session launch until its end. Those calculated metrics that make up the UX score are:
The UX score is categorised into Excellent, Fair, or Poor groupings, allowing you to easily see which of your subscribers are not receiving an acceptable experience.
Infrastructure dashboard
The Infrastructure dashboard provides insights into the health and performance of your VDA machines across your Sites.
As you view the main dashboard, you can see the number of desktops across your site that may be in an unregistered state, failed state, or be under high load, etc.
The Infrastructure dashboard compliments the User Experience dashboard, as if there are performance issues with VDAs, or VDAs are in an unavailable state, end-users could ultimately face performance degradation or compete for a lesser amount of available resources.
Configure on-premises Sites
Unlike Virtual Apps and Desktops service Sites, on-premises Sites need to be manually connected to Performance Analytics.
Requirements
Director 1909 or newer.
Delivery Controllers 1909 or newer.
Director and Delivery Controller servers must be able to reach the following sites:
A Citrix Cloud account with full Citrix Cloud Administrator permissions.
A user account with administrator permissions to Director.
Proxy requirements
If your Director and Delivery Controller servers use a proxy, the useDefaultWebProxy field must be set to true in the following configuration files:
Director: web.config under C:\inetpub\wwwroot\Director\
Delivery Controllers: Citrix.Monitor.exe.Config under C:\Program Files\Citrix\Monitor\Service\
The proxy server must whitelist the addresses listed under the Requirements section.
Configure on-premises Site with Director
To connect your on-premises Site to Performance Analytics, you use the Director console on-premises. After that, data takes around one hour to filter through to Performance Analytics.
Perform the following steps on one Director server connected to your on-premises Site. Other Director servers will update at the next refresh.
From the Director console, click on the Analytics tab.
Click on Connect Site.
Take note of the code you will need to register on Citrix Cloud. The Copy Code button can be used to copy the code to your clipboard. Click on the Register on Citrix Cloud button to be directed to Citrix Cloud.
Navigate to Identity and Access Management -> API Access -> Product Registrations -> Register.
Enter the code you received from Director and then click Continue.
Click Register.
Click Close.
Your on-premises Site will appear as registered with Citrix Analytics for Performance.
The Analytics tab of Director will also show you are connected to the Performance Analytics service.
If you have other on-premises Sites, perform the same steps for each.
Configure on-premises Citrix Gateway
To obtain network related statistics from your on-premises environment, you must configure your on-premises Gateway with ADM service in Citrix Cloud. Gateway 12.1 and later are supported.
Register your on-premises Gateway with ADM service.
Configure HDX Insights on Citrix Gateway.
Enable Advanced analytics.
User Experience Analytics
User Experience Analytics, via a unified dashboard, gives you insight into the different types of experience being received by your end-users when they access resources from your Sites. All of your Sites, whether Cloud or on-premises, are aggregated into this single pane of glass.
Key performance metrics, or factors, that are: Session Responsiveness, Session Logon Duration, Session Availability and Session Resiliency are baselined using dynamic thresholds that then help measure the User Experience (UX) score, which is categorised into Excellent, Fair, or Poor categories. The UX score, marked from 1-100, is assigned to users connecting to sessions hosted from these Sites monitored by Performance Analytics.
Excellent UX – Users with a UX score between 71-100. Users had a consistently good experience across all factors.
Fair UX – Users with a UX score between 41-70. Users had a degraded experience for a limited period of time across certain factors.
Poor UX – Users with a UX score between 1-40. Users had a prolonged degradation across several indicators.
Key performance factors are then further divided into subfactors. For example, Session Logon Duration is made up of Brokering, Authentication, Profile Load, GPO time etc.
Dynamic thresholds for each key factor are calculated for each customer based on the metrics collected during the past 30 days. As an example, I’ve recorded the thresholds for each performance metric in my deployment below to give you an idea of how my Session Experience scores will be categorised and fed into the overall User Experience score. Each customer will have different thresholds. These key performance factors listed below are measured the moment a user attempts to launch a session, until the end of that session.
Session Logon Duration – How long it takes for a session to launch, and for the logon to complete.
Logon time below 35.73 sec -> Excellent.
Logon time 35.73-83.28 sec -> Fair.
Logon time above 83.28 sec -> Poor.
Session Responsiveness – The in-session responsiveness or session latency.
RTT below 188 ms -> Excellent.
RTT 188-300ms -> Fair.
RTT above 300ms -> Poor.
Session Availability – The success rate of establishing a session when attempted by the end-user, versus failure rate.
Failure rate below 10% -> Excellent.
Failure rate 10-20% -> Fair.
Failure rate above 20% -> Poor.
Session Resiliency – How often Workspace app recovers from network failures when the user is connected over a sluggish network. Also known as session reconnection, when the user loses network connection, but the application remains on the screen until the network connection is restored.
Average reconnect rate below 1 per 15 mins -> Excellent.
Average reconnect rate 1 per 15 mins -> Fair.
Average reconnect rate above 1 per 15 mins -> Poor.
Each key performance factor listed above is calculated to form the overall User Experience (UX) score, viewable from the Users dashboard amongst other places. It is also important to note that some of the performance factors carry more weight than others. For example, Session Resiliency has more impact in regard to UX scoring than Session Logon Duration. Each performance factor has a weight applied, Session Availability holds the highest weight.
Using the UX categories on the main dashboard allows you to focus your attention on the users who actually need some help improving their experience. You can drill down into the User Experience categories (Excellent, Fair, Poor), individual performance factors (Session Availability, Session Resiliency, Session Responsiveness, Session Logon Duration), or individual users, via Self-service Search etc.
Overview of Users Dashboard
User Experience (UX)
On the main Users dashboard, you can view the User Experience (UX) score categories previously mentioned. From as little as 2 hours, to as far back as one month. You can also see the Total users over the selected time period, and how many users have had an Excellent, Fair, or Poor user experience. I can view this data across all of my Sites or select specific Sites.
The user experience classifications for all users over the time period selected display in a colour-coded graph, making it easy to trend and identify certain times of the day where users may have experienced less than desirable performance.
You can hover over the colour-coded bars, which displays a tooltip containing information on how many users connected during that time, and how many users made up each of the UX score categories.
The arrows against each category, as shown in the below screenshot, indicate the trend in number of users versus the previous time period. For example, over the past day out of 5 total users, 4 users have had an Excellent UX, which is also 4 more users than the previous day.
User Sessions
Scrolling down the main Users page you next come across the User Sessions section, which displays over chosen periods of time the total sessions, total unique users, and session failures from either all your Sites, or specific Sites.
In this example, across all my Sites, 13 total sessions were launched during the last day from 6 unique users. During this time, 4 session failures occurred which can be clicked in to.
Clicking into the Session Failures brings me direct to a custom Session based self-service search, showing over the past day Launch-Status = “Failure”. Here I can see a user with session failures against a Delivery Group named test. Data can be exported to CSV if desired.
User Sessions – Example Use Case
Knowing how many Active Users have connected to your Site over the past day, week, or month, allows you to license your Site(s) appropriately now, and in the future. You will be able to identify usage trends ahead of time, allowing you to make proactive decisions.
Session Responsiveness
The next section you come across in the Users dashboard is Session Responsiveness, which displays over select periods of time the ICA RTT calculated from each active session across all Sites. Individual Sites can also be selected to view this data.
The RTT is the time it takes for user input to reach the VDA, and the response to appear on the end user’s endpoint, perceived as session lag.
There are Session Responsiveness threshold indicators to the bottom right of the graph, so you know how Excellent, Fair and Poor sessions are calculated etc based on RTT. Remember that performance metrics are calculated using dynamic thresholds, so each customer will have different category score ranges.
If I want to get more information on Fair sessions, I can click the overall number, or click into the coloured bar chart above a time of my choice.
Clicking into the Fair sessions drills down to a custom search view, showing the sessions that had slightly high Session Responsiveness. Each session can be drilled into using the arrows to display that actual RTT, in this example, 113 msec, amongst other information such as the logon time, user name, VDA connected to and so on.
Session Logon Duration
Scrolling down the main Users dashboard you next come across the final section, Session Logon Duration, which displays over select periods of time how many users logged on to your Sites, and what category those logon durations fell into. You can select to view logon duration data across all Sites or specific Sites.
There are Session Logon Duration threshold indicators to the bottom right of the graph, so you can easily see how a Fair session is calculated etc based on logon duration. Remember that performance metrics are calculated using dynamic thresholds, so each customer will have different category score ranges.
The Logon Duration is calculated by measuring phases of the logon process such as Brokering, VM Start, Authentication, Profile Load, GPO and so on, until the application or desktop is ready to be used.
Each Excellent, Fair and Poor category is clickable.
Clicking into a category shows a custom Sessions based self-service search view, and displays the sessions applicable, including logon duration, user name, VDA connected to and so on.
Drilling into the User Experience (UX) – Example
If you want to see who received a Poor UX for example during a specific period of time, under the User Experience (UX) section of Performance Analytics -> Users, hover over the bar chart and click on the Poor UX, red colour coded bar on a time of your choice.
This brings you to the User Experience (UX) Factors page, which shows which performance metric factors caused the poor user experience for all users during that time. In my example, only one user had a poor experience during 11am to 12pm. Each factor can be drilled into to see subfactor specific metrics that make up the score for that key factor, which can help determine if there are any subfactors that continue to impact users and the user experience.
For example, if I expanded Session Logon Duration I could see if it was GPO processing time, Profile Load time, Interactive Session time, or Brokering time etc that caused Session Logon Duration to be categorised as Fair for this user session, or all user sessions during that time period.
Drilling into the subfactors allows us to see specifically what caused poor user experience.
Expanding the Session Availability factor, I can see that this user triggered the subfactor metric Unavailable Capacity four times. It is likely that this user was trying to launch an application but there were no available VDAs or trying to launch a desktop that was switched off. Now that we know the subfactor which caused the Poor experience, we can click on the 1Users text to see the user affected.
Performance Analytics drills further into our available data, and we now see the user affected. Using the arrow, we can expand the box to see some more performance related data for this user between the hours of 11am to 12pm, which can be changed.
Here we can see that out of 7 launch attempts, 4 failed, which would certainly classify this user as receiving a poor experience. Clicking on the user’s name under the USER NAME field gives more information specific to each session.
We now know that connection failures have been occurring against a single Delivery Group named test. It would appear that VDAs in that group are not available. Connections have been successful against the Shared Apps Delivery Group. These numbers, 7 failed 3 successful, is also what we learned from the previous screen.
A Filters pane appears to the left of the screen which, if anything under these circumstances, allows you to see which Site the connections were made against, Endpoint OS and Workspace app version used etc. You can filter on these metrics to really get specific on what data you want to see.
Not categorized
When viewing performance factors and subfactors, you may see at times that they cannot be categorised. This can happen due to general system errors, or:
A session fails to establish, causing factors and subfactors to not be measured.
Session Responsiveness subfactor metrics cannot be measured unless a user is connecting through Citrix Gateway 12.1 or later, which has been configured with Performance Analytics.
Certain Session Logon Duration subfactor metrics cannot be measured for certain reasons. For example, VM Start cannot be measured for non-power managed machines, and Logon Scripts are not measured if you do not have any configured for the session.
User Experience (UX) – Example Use Case
By drilling into the User Experience (UX) factors, over the period of one month for example, I can see out of all my users which subfactor of the Session Logon Duration was scored Fair or Poor the most.
For example, maybe the Profile Load subfactor is continuously scored as Poor for my users. This data gives me something to focus on, for improvement purposes.
As another example, I can drilldown into the subfactors of Session Responsiveness, which will show me out of my users how many had poor Data Center Latency, WAN Latency, or Host Delay. A high poor Data Center Latency count may indicate a problem between Citrix Gateway and the VDAs, for example something in the server-side network.
Remember that to view the subfactors of Session Responsiveness, you need to configure Citrix Gateway 12.1 or higher with Performance Analytics.
None of the subfactor metrics account for packet loss, out of order packets, duplicate acknowledgments, or retransmissions. Latency may increase in these cases.
Searching for users or sessions using Self Service Search
Users
Performance Analytics has a powerful self-service search function that can be used to either search for users, or sessions, under a number of conditions. This can be useful if you receive reports from particular users that their session performance is poor, or you are investigating issues with a particular Delivery Group, VDA, etc.
To the top right of the console, click on the Search button.
Using the drop-down box provided, under Performance, select either Users or Sessions.
For Users, I can click into the whitespace which presents a number of conditions I can search on.
An example search could be to find users that have had a user experience greater than 71, meaning an excellent user experience.
Another search example could be to find users over the last month who have had more than 130 msec of ICA RTT latency.
Other search examples could be to find users who have had over 30 seconds of GPO processing time during the logon, or over 5 seconds of Brokering time.
You can adjust the time from a month right down to within minutes of a particular day.
The Filters box to the left of the Users search allows you to filter viewable data by User Experience, Site, Location, and User Experience Factors. Allowing you to finely tune the data you are looking for.
All data is exportable to CSV format.
Sessions
For Sessions, I can for example look up all sessions for a particular time period that have been launched against a specific machine. I can see the launch status, user connected, performance metrics for each session and so on.
Again, sessions to your filtered search conditions can be displayed from a month down to minutes of a particular day.
You also have the Filter box available to the left, which can be used to refine the data you see. You can filter on Workspace app version, Endpoint OS version, Session Experience, User Experience Factors, Delivery Group, Site Name and Location.
Infrastructure Analytics
Infrastructure Analytics, via a unified dashboard, gives you insight into the health and performance of the VDA machines across your Sites, whether Cloud or on-premises, aggregated into a single pane of glass.
Infrastructure Analytics gives you the number of VDAs across your Sites and more specifically Delivery Groups. How many of those VDAs are usable, or unusable due to being unregistered or in a failed state, how may have Low, Medium, or High Load, and how may are in Maintenance Mode.
This data compliments the User Experience scores. For example, as previously mentioned, Session Failures is an indicator that will affect the UX score. If you are finding a lot of users experiencing session failures, Infrastructure Analytics will help you to determine why that is. It could be due to VDAs being in Maintenance Mode, resulting in a limited amount available that are under peak hours stressed and reporting high load. It could also be because a number of VDAs are in a failed or unregistered state and therefore unavailable for end-user sessions.
Infrastructure Analytics also allows you to see how your VDAs are being used across your Sites. Do you need to scale up, can you afford to scale down, are you having too many occurences of VDAs failing that needs to be addressed, and so on.
Overview of Infrastructure Dashboard
Components
On the main Infrastructure dashboard, the Components section shows Multi-session OS and Single-session OS widgets that display the number of VDAs across your Sites, and whether they are under High Load, Failed or Unregistered. These widgets are very beneficial for getting a quick view of the state of the presentation layer across your Sites.
Clicking on either widget forms the data that will displayed further down the dashboard. In my environment, I only have multi-session OS VDAs. Also, because this is a test environment, I only have a couple of VDAs, so example data will not reflect as well as what production data would do.
VDAs by load
The VDAs by load section is only available for multi-session OS VDAs. Here you can view over selected periods of time the total amount of VDAs usable, and which ones are under Low, Medium or High Load.
By hovering over the graph, you can see the load statistics in more detail for each period of time.
There are load threshold indicators to the bottom right of the graph, so you can easily see how a desktop is classed as having a Low, Medium, or High load.
Unusable & Available VDAs
This section covers quite simply the Unusable VDAs calculated over the selected period of time, versus the Available VDAs.
A VDA may be unusable if powered off, is not registered with a Delivery Controller, is experiencing internal issues, or is encountering network issues etc.
By hovering over the graph, you can see Unusable and Available VDAs statistics in more detail for each period of time.
Note that Available VDAs only applied to multi-session OS VDAs.
VDAs under maintenance
This section displays if any VDAs were in Maintenance Mode during the selected the time frame.
By hovering over the graph, you can see how many VDAs were in Maintenance during the selected period of time.
VDAs by Delivery Groups
The final section of the Infrastructure dashboard provides you with an overview of each Delivery Group in your Sites (or Site if you select a specific Site at the top of the dashboard). Also, how many VDAs are in each Delivery Group, how many are Available, Unusable, or Under Maintenance, as well as the Site in which the Delivery Group comes from, which displays if you select to view All Sites.
Whilst this guide specifically focuses on version 13 of ADC, many of the tweaks that secure what the ADC presents can be applied to prior or later versions. This guide shows you how to obtain an A+ rating score from SSL Labs for your Citrix ADC Gateway vServer, but applies to other vServer types.
When we build a Gateway Virtual Server with default settings and run it through SSL Labs you receive a C score.
Some reasons you receive a C rating are due to SSLv3 being enabled which has various vulnerabilities, and the fact that Secure Renegotiation is not configured. Another thing to note is that all certificates in your certificate chain uploaded to ADC must be SHA2 issued.
Firstly, to improve the rating, you want to replace the default ciphers offered by the Gateway vServer with more secure ciphers. On ADC, navigate to Traffic Management -> SSL -> Cipher Groups -> Add.
Specify a Cipher Group Name and click Add.
Move the following secure ciphers to the right. I’m selecting ciphers that are most secure at this time. Also note that ECDHE (Elliptic Curve Ephemeral Diffie-Hellman) ciphers include Forward Secrecy, so should always be at the top. You may need to enable some additional ciphers to support older clients such as Windows 7 or older browsers used within your organisation. Create the new Cipher Group.
TLS1.2-ECDHE-RSA-AES128-GCM-SHA256
TLS1.2-ECDHE-RSA-AES256-GCM-SHA384
TLS1.2-ECDHE-ECDSA-AES128-GCM-SHA256
TLS1.2-ECDHE-ECDSA-AES256-GCM-SHA384
Now browse to your Gateway vServer and click the pencil icon next to SSL Ciphers.
Click the minus symbol beside DEFAULT to remove it.
Next click on Cipher Groups and select your newly created Cipher Group from the provided list. Click OK.
You should only see your secure Cipher Group in the list. If DEFAULT is still showing, go back in and remove it again.
At this stage, without doing any further configuration, you will have an A- rating.
Now we will create a secure SSL Profile and bind it to the Gateway vServer. Browse to System -> Profiles -> SSL Profile -> Add.
Specify a name for your SSL Profile.
Set Deny SSL Renegotiation to NONSECURE.
Check HSTS and set Max Age to 15552000.
Under Protocol ensure that SSLv3, TLSv1, and TLSv11 is unchecked. Click OK -> Done to create the SSL Profile.
Browse back to the Gateway vServer and using the SSL Profile drop-down box, select your newly created SSL Profile then click OK -> Done.
And there you have it. A+ rating on the Gateway vServer.
If you need to change the time zone on an ADC HA pair, you might not be concerned about difficulty. Whilst indeed it is a fairly simple task to carry out, there are specific steps that need to be carried out on both appliances.
Firstly, on the primary appliance, run the following CLI command:
set nsparam -timezone GMT+01:00-BST-Europe/London
Note: Specify the time zone of your choice. To view a list of time zones, run CLI command show timezone.
Now save the running config using CLI command save nsconf.
Next reboot the secondary node. After a few minutes of uptime, this node should reflect the new time zone. You can confirm this by running CLI command show nsparam.
At this time, the secondary appliance is good, however, the primary appliance will still be reporting a time from the previous time zone. To update this, we need to perform a cold reboot of the primary appliance.
Firstly, force an HA failover using CLI command force failover and then issue a reboot to the primary appliance.
When the now secondary appliance is back online, it will report the correct time.
The COVID-19 pandemic has disrupted how every business on the planet works. Remote working has become the new normal, and IT needs to adapt quickly to support this somewhat new way of working.
I say new way of working, but it isn’t actually new at all in the grand scheme of things.
People have been working outside of the office, such as from home or other public places, for many years now. Organizations such as Citrix have provided technologies that have helped with achieving this, and many times in the IT industry we hear how the office is now just another place people can stop by to work from.
However, working remotely may now be for many of us the new normal. While there are organizations that previously had staff working from home one or two days a week, these organizations may now have staff working from home full time or the majority of their working week.
On the other hand, some organizations did not have staff working remotely at all. These organizations have had to adapt quickly because of the pandemic, and that may have been a rushed, painful process especially if the organization did not initially have the correct infrastructure in place to allow effective remote working.
Organizations now have staff working from home all over the country, and staff depending on remote technology could be using either their personal devices, or corporate laptops. To support this shift, Citrix Gateway could be configured within the organization’s private or public cloud to allow for secure remote access to virtual applications and desktops. With Citrix Gateway acting as an ICA proxy, staff may be allowed by the organization to use their personal computers, laptops, or tablets such as an iPad.
Other organizations may use the Citrix Gateway for VPN access, and have staff again use their corporate devices, or personal devices subject to posture checking.
IT loses visibility and control
These technologies such as VPN and ICA proxy are great at allowing efficient remote working, however there are more external factors introduced with remote working that can impact the end-user experience. We now have staff connecting into our datacenters from a range of different internet connections, from 3G, 4G, Wi-Fi hotspots and broadband. This is something corporate IT can’t control.
Further to this, if staff are likely using their personal devices to connect in, those devices in some instances could be the latest and greatest Windows 10 or Apple devices that are fully patched running the latest versions of web browsers and Citrix Workspace app. This is often only a very small percentage of the userbase though, as most devices will run a mixture of operating systems from Windows 10 to Windows 7, and older macOS versions that have not been updated in 3-4 years. I often find these devices also running unsupported versions of Citrix Receiver that simply haven’t been updated since they were initially installed.
Staff still expect that if they can connect to their virtual apps and desktops, that the performance they receive is similar to what they were used to when working from the office. That is, minimal lag, a responsive application that also launches quickly, and is available whenever they need it.
The rise of multimedia
Audio and video technologies such as Zoom, and Teams have become much more popular due to the pandemic and staff working remotely. People need to stay in touch daily, from having meetings regarding ongoing projects or simply keeping in touch to prevent feeling isolated.
Usage of Teams has more than doubled in recent months, with now over 70 million active users using it around the world. Bandwidth consumption can range from 30kbps to over 1Mbps depending on if you are audio calling or in a group video call.
It is important to keep in mind that these multimedia platforms do have the ability to consume more of your available bandwidth, and for those staff members who have lower quality broadband in the home, there could be bandwidth contention with your virtual apps and desktop sessions. I should also mention the fact that if you have other members in your household streaming or playing online games from a range of devices, those activities will further add to the bandwidth contention of your home broadband.
The remote worker, returning to the office
Since the initial months of the pandemic, some restrictions are being lifted across different countries and people are allowed to return back to the office, though often in limited numbers.
Some staff are also returning to the office on a part-time basis, but the change of toolset has created a potential new problem. All these multimedia applications such as Zoom and Microsoft Teams that were adopted for keeping connected, will continue to be used even as staff return to the office.
Because of this, what starts to happen is that gradually a much higher demand is placed on the office network. The more people that return, the higher the bandwidth utilization is likely to be, higher than ever before.
Users will still also obviously continue to launch their virtual apps and desktops whilst in the office, but with the much higher bandwidth contention with peers, the ICA channels could be impacted, causing slow application launches, slow in-session performance and so on.
Ultimately, the risk of tickets reaching the desk for “Citrix is slow” problems may be more common.
Pinpointing the slowness
From an IT perspective, Citrix admins need to be able to pinpoint where the slowness is coming from when an end-user reports that “Citrix is slow” from the office or remote. Is it the home network the user is connected from, the user’s personal device, the entire corporate office, or something in the datacenter with the Citrix VDAs?
For example, it could be the end-users home network due to household members using Wi-Fi for streaming and playing video games, leading to bandwidth contention which is impacting the end-users ICA session to their virtual apps and desktops.
On the other hand, it could be that the end-user’s personal device is running poorly. Maybe it is running on quite old hardware, or there has been a lot of third-party software installed on the device which is causing high RAM or CPU utilisation. Such problems can impact the launching and in-session ICA performance, however the end-user may report to the helpdesk that Citrix is slow, not knowing that it is caused by their own device. This leads IT down the wrong path from the beginning.
Also, staff may now be reporting slowness after a return to the office, with the usage of Zoom and Teams still high, because the network infrastructure was not designed for the larger amount of traffic end-users are now pushing through it.
IT need purpose built monitoring tools to help pinpoint where the issue lies, and to quickly rule out if the issue is not with Citrix at all.
How ICA channel, network and latency monitoring can help
A purpose-built monitoring tool that can monitor each of the individual ICA channels, the end-user’s network and latency is a powerful solution to have at your disposal. Goliath Performance Monitor for example has such ability to monitor each channel and you can be selective about what channel to investigate when troubleshooting:
In the below example, an end-user reported that their session became slow suddenly and wanted to know what happened. Upon review, we can see that the end-user experienced a sudden spike in network latency, which caused the ICA latency to jump up.
At the same time, we were able to see that the user’s connection speed dropped simultaneously, which we can correlate to the sudden spike in network latency. Obviously, something happened on the end-users network at that time to cause a drop, which could have been a burst in demand for available bandwidth or just temporary slowness from any of the hops coming into the organization’s datacenter.
Finally, in this example, an end-user similar to the scenario before encountered a sudden spike in ICA RTT latency, but this time it was not actually anything user-side which caused the problem.
Upon comparing the VDA CPU utilization the end-user was connected to at the time, we can see the CPU usage increase for a period of time that matches when the ICA RTT latency jumped. This eliminates any doubt over the end-user connection, which can also be tracked under Network Latency and appears to be very stable throughout.
Summary
Remote working, and higher usage of multimedia solutions are here to stay. What that also means is troubleshooting slow session and end-user experience issues is not going away any time soon.
Luckily, there are solutions out there that can help assist and guide Citrix admins to typical “Citrix is slow” resolutions so that you don’t spend any extra time troubleshooting, especially when you cannot see the full picture for those users remotely connecting from various internet links and from personal devices.
As you can see from these examples, with actual data driven proof you can quickly isolate root cause, have your users back up and running quicker and spend less time troubleshooting end-user problems.
To learn more about how to troubleshoot “Citrix is Slow” by understanding data from ICA/HDX protocol, check out this Technical Guide to Citrix ICA/HDX sponsored by Goliath Technologies.
Latency, the delay before the transfer of data, is one of the critical user experience measurements for many technology solutions, and one of the top when judging the quality of end user experience on Citrix Virtual Apps and Desktops.
Why is Citrix Slow?
Have you ever received a “Citrix is slow” user complaint? I will expect the answer to be yes. It is very common, even more so for remote workers. The reason Citrix is slow might not be related to high Citrix ICA latency at all, but there is a good chance it is. You see, there are multiple reasons why latency could be high for a user remotely connecting to their Citrix app or desktop using something like Citrix Gateway or full VPN, as such:
User is connected to WiFi but the signal/coverage is poor.
User is connected to public WiFi which has a bandwidth cap, or contention from other people sharing the same connection.
Local device network cards or wireless adapters running old, outdated drivers, or there could be hardware faults impacting network performance.
Packet loss experienced due to old or faulty broadband equipment that needs to be refreshed by the broadband provider.
Local device running low on RAM and available CPU, causing lag to ICA session.
Local broadband overloaded by other household members streaming videos or playing online games.
Overall public internet overloaded due to increase in usage caused by COVID stay-at-home requirements.
To help gauge user experience, Citrix latency is defined by two metrics:
ICA RTT – This is ICA latency and Thinwire latency, aka the time between the user clicking or typing into something on a virtual app or desktop, and the moment that action is graphically displayed to the end-user. For example, clicking on a menu drop-down within an application, or typing into an Outlook mail window. This can be more easily known as screen lag. Application performance could increase ICA RTT.
Latency – Otherwise known as ICA Latency, this metric captures the bottom-line network latency and ICA stack latency between the client and VDA server. For example, latency between client-side Winstation Driver and VDA Winstation Driver. Think similar to a ping test. System performance could increase ICA RTT and ICA latency.
How does ICA round-trip latency impact the user experience?
When ICA round-trip latency is high, the end-user may notice a delay when they click or type within their ICA session. Citrix technologies are quite good at controlling latency and minimizing it where possible with features like Adaptive Display and Adaptive Transport, but there will be times when the latency is too high and the end user experience starts to become impacted. It is at these times when you may get those “Citrix is slow” complaints and have to start some investigations.
Remember that many of your remote workers are accustomed to working from the office, where they receive a low latent connection to their virtual apps and desktops. This results in the end-user having a certain expectation for the performance of their session. They know the experience they normally get when working within the office, and they expect the same experience when connected remotely.
Now that we have some metrics from Citrix, we can easily look up the affected user session and immediately understand ICA RTT for that session. However, what do the numbers mean?
Everyone will have their own perception of good and bad latency, and personal opinion mixed with experience will determine what the numbers mean to you. Also, depending on the application and desktop in use, latency may not impact users the same way.
I typically like to categorize the numbers into Great, Good, and Poor. The numbers I use to categorize are estimated, so the categorization is more general. For example, you could adjust the numbers by 30ms either way, but from my own testing and experience I would categorize them as follows:
Great: Typically, anything between 20-180ms.
Good: Typically, anything between 180-240ms
Poor: 240ms+
The challenge is finding what causes the latency. Is it the user’s home network, Citrix Gateway, internal network, VDAs, high CPU, etc? If you want to find the root cause, you always need more information rather than having numbers thrown at you. Unfortunately, most of the time, Citrix’ internal tools, like Citrix Director, will not provide enough information to understand what is causing the latency. This is when you need to turn to other products, specifically purpose-built to monitor Citrix. Solutions such as Goliath Performance Monitor can now only show the numbers, but also explain the reasons for them.
Make Citrix Troubleshooting Easy
With Goliath, IT administrators, or even the support desk, can find any existing or historical user session. Now when the admin begins to investigate a ‘Citrix is Slow’ ticket, they can navigate to that user session and quickly identify if that user is experiencing high latency (Image 1).
Image 1: Goliath’s Virtual Apps and Desktops view displays both active and historical user sessions to support Citrix troubleshooting.
Then by clicking into that user session, you as an IT admin can see every IT element that could impact that end user’s session. From the user’s endpoint, to logon details, to connection and user behavior, to all Citrix and supporting infrastructure components. Knowing the user has high latency, you can click into the ICA/HDX tab. Here you can now see additional correlated metrics you don’t get with Citrix alone, that prove root cause of the slowness. In the example in Image 2, this user has both high latency and network latency above 240ms and in that same period slow connection speed well below 10mb/s. As an admin, you can draw the conclusion and prove to the user the slowness is an issue with the connection point before reaching Citrix Gateway. If all else looks good in the data center, root cause is most likely an issue with the user’s home ISP.
Image 2: Goliath correlates latency metrics from all ICA/HDX channels, enabling IT admins to isolate and prove root cause of remote worker issues quickly. In the use case above, the root cause is somewhere in the connection point to the Citrix Gateway. There is a high likeligood then it is an issue with their home WiFi if everything else looks good in the data center.
Goliath offers additional insights into a variety of ICA channels that can help IT Pros identify and prove root cause from audio or graphical files consuming too much bandwidth, a large print job stuck in queue, or even if a large clipboard file exists, all potentially negatively impacting user experience. When it comes to troubleshooting remote worker slowness issues, latency is to confirm the issue is present, but as an admin you need additional correlated, metrics to prove root cause and resolve.
In my recent article Understanding Citrix Latency Metrics to Troubleshoot Remote Worker Issues, I explained some causes to “Citrix is slow” complaints and delved into the latency metrics that are available to assist with troubleshooting.
Another
area we can look at is the ICA/HDX virtual channels, which provide the
functionality and communication required between a Citrix Workspace app running
on an endpoint and a Virtual Apps and Desktops Virtual Delivery Agent running
Desktop or Server OS.
Citrix
Virtual Apps and Desktops ships with a number of virtual channels out of the
box. There are virtual channels for:
Audio
COM ports
Disks
Graphics
LPT ports
Printers
Smart cards
Video
Third-party custom virtual channels
The
client running Citrix Workspace app has a number of virtual channel drivers, in
the form of DLLs, that are able to communicate with Virtual Apps and Desktops (VDAs)
and the applications running on them. Whenever a client connects to Citrix Virtual
Apps and Desktops, it passes information about the virtual channels it supports.
The VDA is then able to hook into the virtual channel, allowing data to flow,
encapsulated in the ICA stream.
Some
virtual channels are required for normal operation, while some others are
optional and there to provide additional functionality if required. There can
also be multiple virtual channels active at one time (Image 1).
Image 1: ICA/HDX virtual channels are present in an end-user session when the user has such behavior as listening to audio, watching video, or using a 3rd party peripheral device like a printer or thumb drive.
How can we monitor Citrix ICA virtual channels to our advantage?
Citrix
ICA virtual channels might not be something you often think about when
troubleshooting, but there are scenarios where having insight into them can
help aid finding root cause of end user issues. There are also 3rd
party tools, like Goliath Technologies, that make finding and using ICA/HDX
channel data easier (Image 2).
Image 2: Goliath monitors all relevant ICA/HDX Virtual Channels and their performance for each individual user session. This way IT Pros can use the data to prove user behavior is root cause of end user experience issues.
With
almost everyone now working from home due to stay-at-home requirements, we hear
a number of common complaints from our end users such as:
Audio playback is muffled, choppy, or not clear.
Video playback is buffering or not clear.
Printing is not working or takes a long time.
Client drives are not accessible.
These
behaviours are all supported by Citrix ICA/HDX Virtual Channels. Understanding
their metrics can provide insight into what a user is doing when experiencing
performance issues.
Typically
for these requests you may start checking over Citrix Policies, asking the user
to upgrade their Workspace app to the latest version, or to try logging off and
on again.
Instead,
why not take a look at virtual channel monitoring data? It might actually give
you some clues as to what the root cause is.
Example 1: Audio quality is poor
In this
example, an end-user calls the helpdesk and reports that since working from
home, audio performance is poor. Whenever playing audio files from her remote
desktop, the audio is choppy and sometimes skips.
Upon
investigating the Audio virtual channel while the user is playing back audio,
you can see that the output bandwidth being used is rather low and is the cause
of poor audio performance.
This was
caused by the Audio quality Citrix policy being set to Low – for
low-speed connections. Setting to Medium allows for increased
throughput gains and better audio quality.
Without
witnessing the low output bandwidth, it may not have been evident that a policy
setting was incorrectly set.
Third
party software can better visualize ICA/HDX virtual channel information for IT
Pros, making it even easier to troubleshoot issues. Below is a screenshot from
Goliath Technologies where at a glance you can see not only is ICA RTT spiking
above industry best practice thresholds, but it is doing so at the same time
the Audio BW Out channel is seeing a spike. As an IT Pro, you know this user is
consuming too much audio bandwidth which is negatively impacting the user’s
session. Now IT Pros can talk to the users about their behavior, like listening
to Spotify while working, and determine resolution for slowness.
Image 3: Goliath correlates latency metrics from all ICA/HDX channels, enabling IT admins to isolate and prove root cause of remote worker issues quickly. In the use case above, the root cause of slow performance is due to the user’s behavior using too much audio bandwidth within their session.
Example 2: Client drives are not accessible
In this
example, an end user calls the helpdesk and reports that his client drives are
not visible when using Epic Hyperspace, the organization’s Electronic Health
Record system. This is preventing the end user from importing documents into
Epic.
As the
Citrix administrator reviews the virtual channels running under the affected
user’s session, he notices that the Client Drive Mapping virtual channel is Idle.
This wasn’t necessarily expected, but upon further investigation was due to the
Client drive redirection policy being prohibited for Citrix Gateway
connections, which can be quite common as a security measure against external
connections into Virtual Apps and Desktops.
The
administrator saved time by first checking the state of the virtual channels
and then, with the evidence, reviewing the Citrix policy configuration for
external users.
Example 3: Printing is slow
Printing
is one of the most widely used functionalities within Citrix Virtual Apps and
Desktops, and the ICA Printing virtual channel takes care of mapping printers
into sessions and transferring print jobs to endpoint printers or print
servers.
In this
example, an end user calls the helpdesk and reports that printing is much
slower now than when in the office.
By
monitoring the printing virtual channel, a Citrix administrator was able to
track print jobs and the bandwidth that the print jobs were utilising. The
bandwidth utilisation was low and therefore the cause of poor printing
performance.
What the
Citrix administrator also noticed is that the Thinwire virtual channel was
consuming a lot of bandwidth. This evidence allowed the administrator to have
an informed conversation with the end user and discover that the user was
watching a training video while attempting to print, which was contending for
overall session bandwidth. In this example, the user was able to print once
video playback was stopped. Alternatively, the Citrix administrator could have raised
bandwidth limits via Citrix policies to solve this issue.
By
looking deeper into ICA/HDX channels, IT Pros can more quickly isolate and
prove root cause of poor session performance isn’t always Citrix, but the end
users behavior while using Citrix.
About Goliath Technologies
Goliath Technologies offers software that is purpose-built for monitoring and troubleshooting end user experience issues, and can more easily correlate and present ICA/HDX virtual channel metrics alongside all other potential metrics that could impact performance. To learn more on Goliath visit goliathtechnologies.com or email techinfo@goliathtechnologies.com to set up a demo.
For several years I have worked with healthcare customers deploying, managing, and supporting Citrix environments that serve applications and desktops to thousands of users.
Citrix Virtual Apps and Desktops tends to be a popular choice for healthcare customers wanting to virtualize their applications and desktops, often due to the complexity of health IT, supporting many different applications from SaaS to modern thick apps and legacy apps, providing access out to other healthcare organizations, and keeping patient data secure at all times. Citrix performs well in this field and can solve many of the challenges and requirements mentioned.
With healthcare though, due to how healthcare staff work, their needs, and the typical applications that are used, there are particular issues that I have witnessed in this field that I haven’t so much witnessed in others, or at least not to the same scale. As such, I would like to highlight the three I have come across most recently and how you can help avoid or troubleshoot those issues more efficiently.
Audio and Dictation Issues
Dictation in particular is prominent in healthcare. With the many consultant visits by patients every day, the consultant dictates notes for that patient into their EHR app, for a secretary then to transcribe the audio to text, into a letter that can be sent to the patient or simply to be stored on the system. This method of work uses a consultant’s time efficiently.
I have seen in the past secretaries complain of poor audio quality in relation to these dictation audio files. Sometimes audio skips, slows down and then speeds up, and so on, or does not work at all.
Figure 1 – Audio bandwidth (bright green line graph in bottom left chart) is being heavily utilized when there isn’t much bandwidth available for Citrix (top right graphi with connection speed) which can lead to poor experience.
Audio in a Citrix Virtual Apps and Desktops environment can be subject to poor latency, having a negative effect on how audio is delivered to the client. Otherwise, it could simply be impacted by missing best practice configuration.
To troubleshoot, if the issue is poor audio quality, firstly check the user’s latency when they are connected to Citrix. This is the most simple and quickest thing to check first. You can use a tool like Citrix Director, or your third-party solution if you have one. You should also check if the ICA connection is facing packet loss. This is a little more difficult when using a tool like Director, but can be achieved using third-party tools like the Goliath Performance Monitor from Goliath Technologies, or some packet captures between the endpoint and Citrix server. If the user is working remotely, you will want to make sure your third-party tool, if you have one, can still report on latency.
Secondly, you should analyse the consumption of the audio virtual channel. I have written an article previously explaining how incorporating this task into your troubleshooting steps could help you determine if audio bandwidth throughput is low due to a misconfigured Citrix policy, or due to other virtual channels contending for the user’s bandwidth, such as high video bandwidth consumption, which can then negatively impact the audio virtual channel, especially if no QoS is in place.
Finally, to avoid many of the audio performance problems your users may face in the first place, you should take a task to review your audio configuration for your Virtual Apps and Desktops deployment. As a starter, the Audio quality policy in Citrix Studio should be set to Medium. Secondly, you should adopt the use of Audio over RTP (Real-time Transport Protocol). This is the recommended protocol to use when delivering audio from a Citrix environment to the end user. It does require some configuration and firewall policies to be open but has most definitely in my experience solved many audio quality issues in the past.
Long Logon Times
Long logon times and associated user complaints are not unique to healthcare environments in any case, but healthcare has some of the highest user logon counts across any industry. Firstly, healthcare organizations typically run 24/7, and staff come and go as part of shifts. This means that throughout a day or week, the number of times that EHR app delivered via Citrix is launched enters the thousands. On the other hand, an individual user may launch a Citrix session multiple times per day. The hospital has many different kiosk or shared workstations that are used by many clinicians each day, and individual clinicians may launch Citrix apps from several PCs as they move between wards and so on.
That is why logon times are crucial for healthcare, because if those logon times are slow, they will most likely be realised in a healthcare environment, and the helpdesk are most likely to receive calls about it.
To troubleshoot, you really need the aid of a monitoring solution that can help track each step of the logon, and report on the time it takes to complete each step. The Citrix logon process contains many different steps such as Group Policy printing, logon script execution, printer and drive mappings, desktop load, brokering, user profile load, and so on. Without knowing which step is causing the overall process to be slow, you can’t begin to troubleshoot effectively.
Figure 2 – the benefits of the log on drill down
However, that said, what I do recommend is that you take a process of elimination approach. Check for patterns and consistencies to the issue, such as if it’s a particular location that is impacted by long logon times, a particular set of users, users on a particular set of VDAs and so on. You will want to review the health of your entire infrastructure, from the network, to storage, hypervisor hardware, and the virtual infrastructure. Again, based on if you have the right monitoring solution in place or not will determine how manual and time intensive these steps are, and how many other different teams you need to involve.
Printing Issues
The final piece I wanted to talk about is printing. Clinicians or medical staff cannot print at all, or print jobs are not rendering as expected.
Again, like the number of logons, the healthcare industry prints more than any other industry I have worked with, which makes printing very important, and as it affects patient care, something that cannot go wrong!
However, it often does go wrong. Printing is complex. Print devices are deployed en-masse all over the environments in their hundreds, some wireless, others hardwired. Then you have the print servers that contain many different print drivers for each of your device types, and often those drivers are old or simply unstable and that can lead to things like spooler crashes.
To troubleshoot printing issues effectively, first understand the scope and impact of the problem. Are the issues affecting multiple people, what type of print jobs are the users trying to print, what devices are they trying to print from. For example, if it’s a single device, you are going to troubleshoot the issue from a different angle compared to if the issue was affecting multiple devices.
Figure 3 & 4 – The Output Printer Bandwidth (dark blue line in screenshot a, and dark blue in line in bottom left graph of Figure 4) is being shown in the Goliath performance monitor view as heavily utilized showing that there was a large print job. This session was missing data (no RTT on the ICA Performance Graph in the top left of screenshot b), and the important point would be to correlate that spike in printer bandwidth with a spike in RTT showing a correlation between the large print job with poor experience.
Also, keep in mind that no print job is the same. Some prints flow through Citrix, whilst others may flow through a healthcare organizations EHR infrastructure. So, knowing the type of print again will shape how you begin to tackle the issue, and where you begin to look.
If you have the ability through third-party monitoring solutions, track the print job as it flows through your infrastructure. Maybe the job is reaching the print server and spooling, but not arriving at the physical print device, or maybe it’s not spooling, or reaching the print server at all.
Asides understanding the scope and impact, and understanding the type of print job etc, you will want to check the health of your print servers and components a print job may travel through. Check to make sure there has not been any spooler crashes, typically due to bad drivers, and that print queues are responding to requests. You may even send engineers on-site to investigate the physical elements from the print device itself to the network connection piece. In many cases, a monitoring solution can automate many of these checks, so you can find route cause quicker.
Summary
If you support a Virtual Apps and Desktops environment in a healthcare organization, audio quality issues, slow logins, and printing woes are likely something you have come across during your time.
To be one step ahead in finding root cause, or catch issues before end-users are impacted, you ideally will have a monitoring solution that can monitor your entire infrastructure and has functionality specific for Citrix deployments.
Without the help of a monitoring solution, you are left with a more manual approach to troubleshooting, which can burn up many more hours than anticipated which isn’t ideal in any industry, not to mention healthcare were patient care could be impacted as a result.